Showcase Customer Engagement with Funnel Infographic
Product Description
As a sales manager, effectively communicating how customers engage with your brand is critical, yet it can be tough to relay this information clearly. If your visuals don’t capture the essence of the customer journey, your audience might miss the key points.
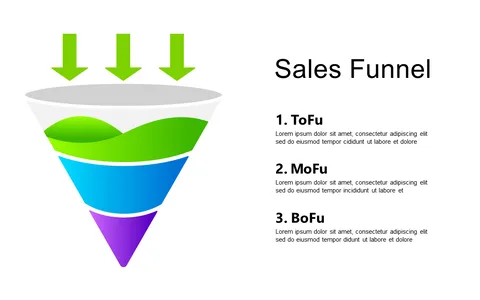
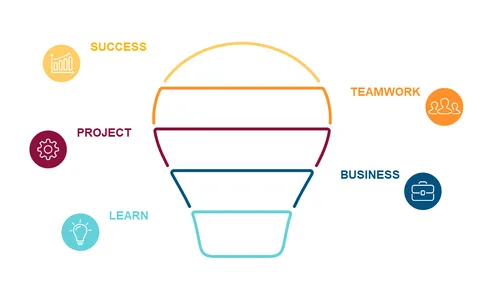
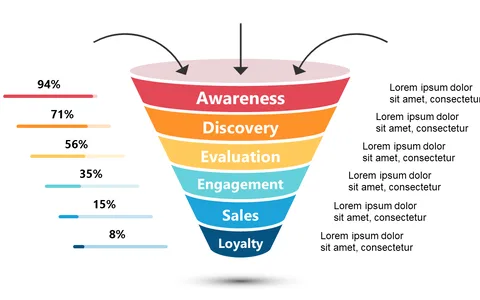
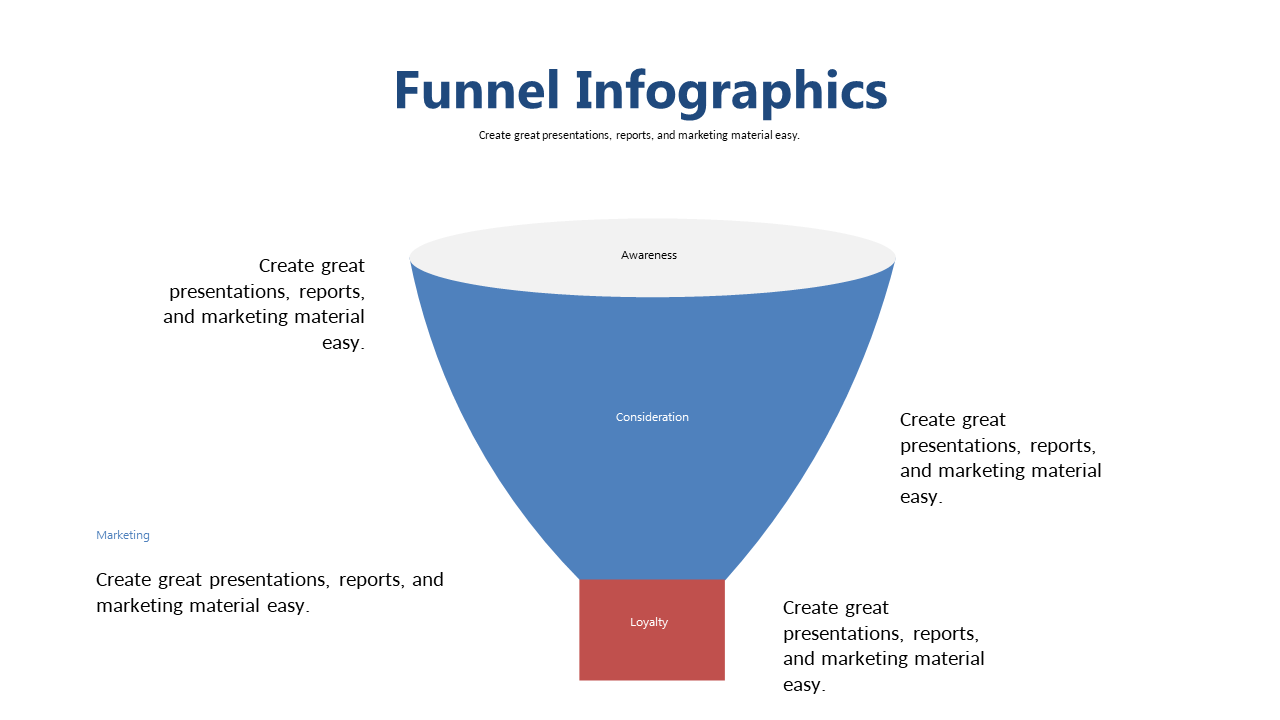
This slide presents a simple yet striking funnel infographic that clearly outlines each phase from awareness to loyalty. This slide is perfect for sales managers, team leaders, and business developers who need to present engagement metrics during strategy meetings, client discussions, or training sessions. It allows you to highlight important metrics and strategies visually, making your presentations more impactful.
For just $0.99, you can download this slide instantly and incorporate it into your projects. Fully editable in PowerPoint and Google Slides, it’s easy to tweak for your specific context, making preparation a breeze.
$0.99 – Purchase Checkout
Added to cart