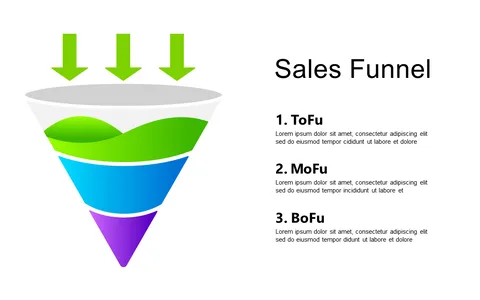
Engage Audience with Three-Stage Funnel Infographic

Product Description
Engaging your audience with complex data can often lead to confusion rather than clarity. You want to ensure your message lands effectively, so using a simplified visual representation of the customer journey becomes essential.
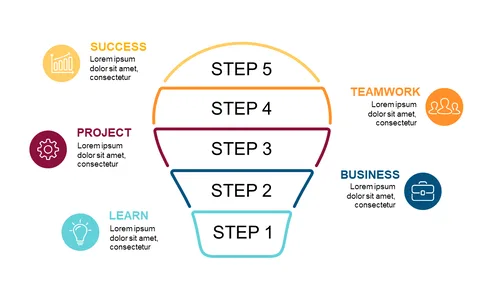
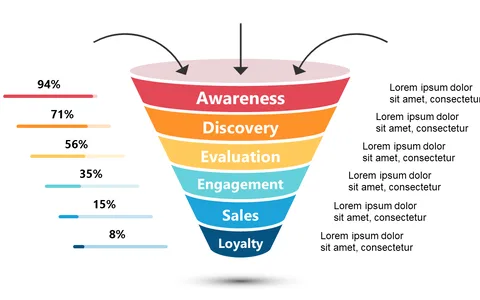
This three-stage funnel infographic helps you present your point powerfully and clearly, without overwhelming your audience. This slide is particularly useful for sales managers, marketing directors, and content creators during presentations or strategy sessions. It’s great for illustrating the customer journey phases in a way that resonates with your audience, whether you’re discussing new marketing initiatives or analyzing performance metrics.
You can grab this slide for only $0.99, making it a smart choice for enhancing your presentation toolkit. It’s easy to customize in PowerPoint or Google Slides, so you can make it your own within minutes and focus on delivering your insights confidently.
$0.99 – Purchase Checkout
Added to cart