Identify Issues in Food Marketing with Fishbone Diagram
Product Description
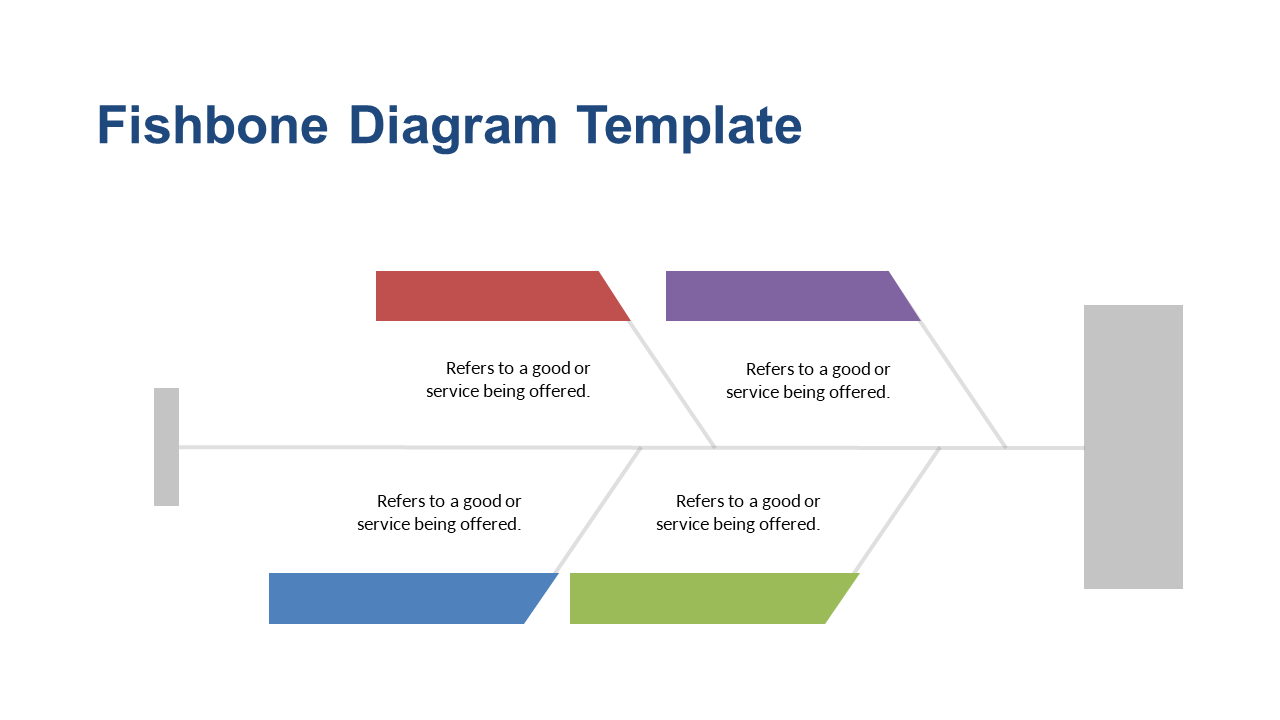
Navigating the complexities of food marketing involves pinpointing specific issues that may be holding your efforts back. This Fishbone Diagram slide organizes various contributing factors, making it an invaluable tool for presenting challenges clearly and effectively.
Marketing strategists, food product developers, and business analysts will find this slide essential during brainstorming sessions, troubleshooting meetings, or strategy workshops. It sets the stage for constructive discussions and encourages collaborative problem-solving.
For only $0.99, you can download this slide instantly, and it’s fully editable in PowerPoint or Google Slides. You’ll have the perfect visual aid ready to enhance your next presentation!
$0.99 – Purchase Checkout
Added to cart







