Illustrate Processes with Steps and Decisions Flowchart
Product Description
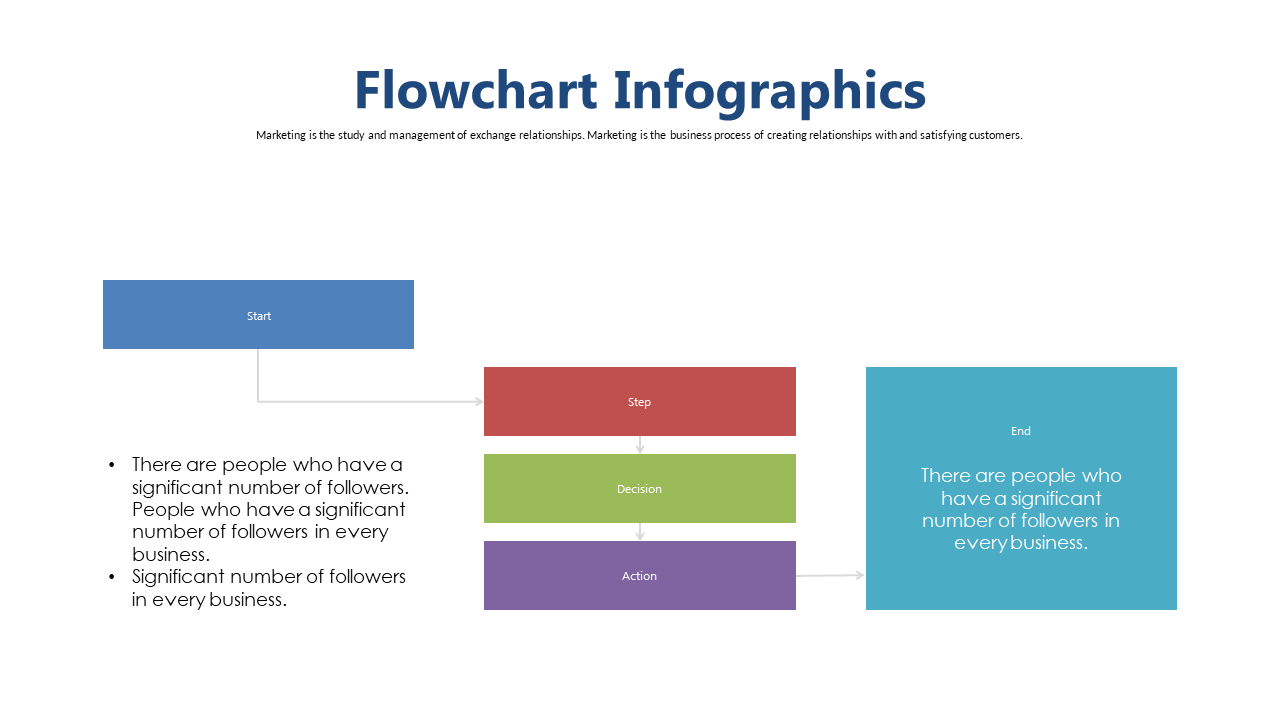
Explaining complex processes can often lead to confusion if you rely solely on text-based descriptions. A visual flowchart can effectively illustrate each step and decision point in a way that keeps your audience engaged and informed.
This slide makes it easy for you to present detailed workflows that are straightforward and compelling. Perfect for business consultants pitching new strategies, training coordinators conducting workshops, or product managers outlining project timelines, this flowchart is versatile and applicable across various roles and industries. It ensures that every participant is clear on the process being discussed, leading to better collaboration.
For just $0.99, you can download this slide instantly, ready for immediate use. Editing it in PowerPoint or Google Slides is simple, allowing you to customize it to fit your presentation style in mere moments.
$0.99 – Purchase Checkout
Added to cart







