Customizable Fishbone Diagram for Cause Analysis
Product Description
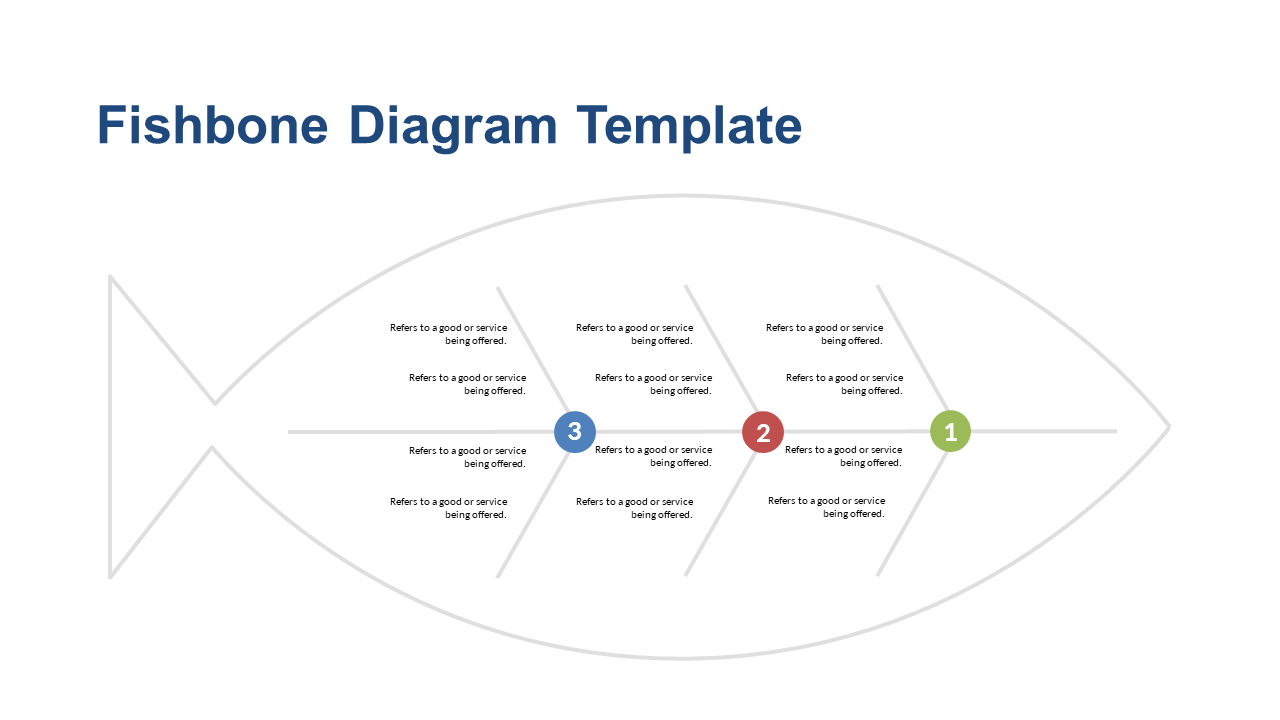
When you’re faced with a complex problem, having a clear visual tool can significantly impact your analysis. This customizable fishbone diagram is designed to simplify cause analysis, enabling you to identify and categorize issues quickly.
It’s a practical resource that enhances your team’s ability to focus on solutions. Consultants and team facilitators can effectively incorporate this slide during workshops or training sessions on problem-solving techniques. It serves as a valuable aid for presenting findings to clients or stakeholders during project updates, especially when addressing quality issues or performance gaps.
At just $0.99, this fishbone diagram slide is available for instant download. You can easily edit it in both PowerPoint and Google Slides, giving you the flexibility to adapt it for various presentations in no time.
$0.99 – Purchase Checkout
Added to cart