Visualize Causes with Fishbone Diagram and Arrows
Product Description
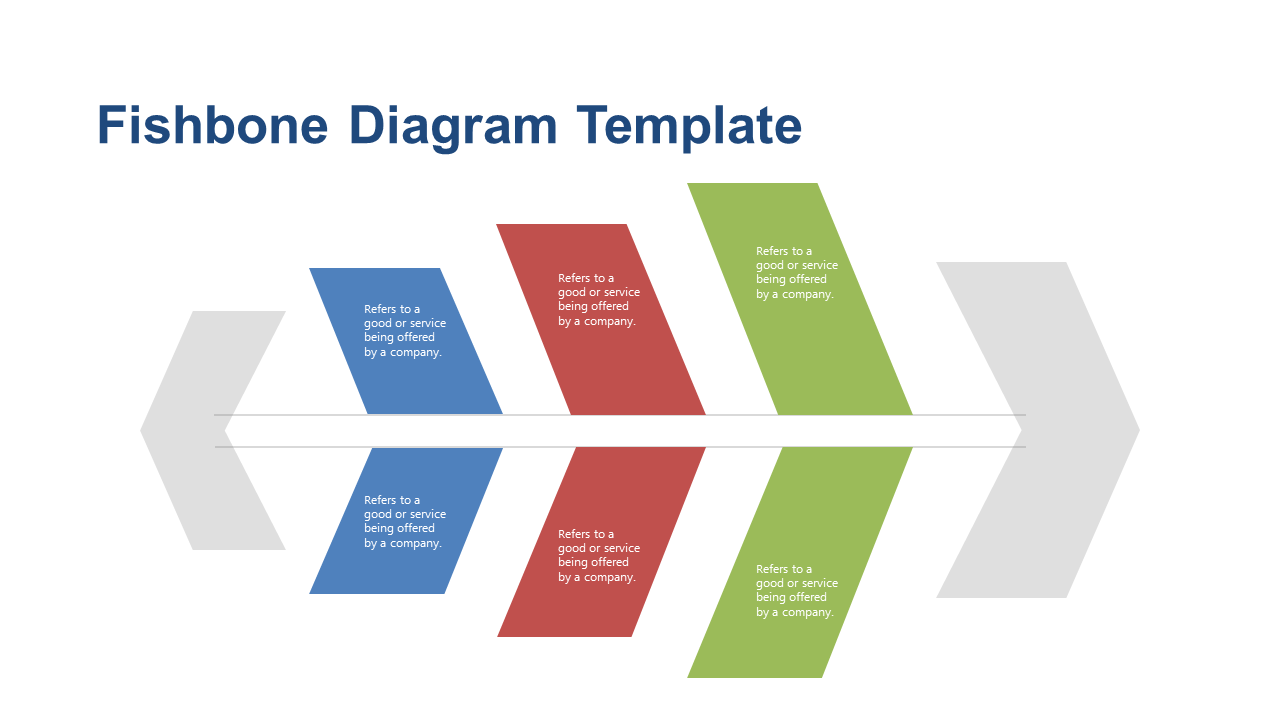
Complex problems can often leave teams feeling lost, especially when it comes to identifying their root causes. You need a straightforward way to visualize these causes, and a fishbone diagram is an ideal tool for this. By categorizing different aspects of the problem, this slide helps to clarify discussions and drive focused analysis.
Project managers in industries like manufacturing or IT can use this slide during root cause analysis meetings or process improvement discussions. It’s perfect for brainstorming sessions where team members gather to dissect issues and find solutions collaboratively.
Whether you’re in a performance review or a strategy session, this slide can enhance your presentations. For just $0.99, you can instantly download this fishbone diagram slide, making it easy to edit in both PowerPoint and Google Slides. With a clean design ready to go, you’ll have everything you need to present your findings in minutes.
$0.99 – Purchase Checkout
Added to cart