Editable Fishbone Diagram for Root Cause Analysis
Product Description
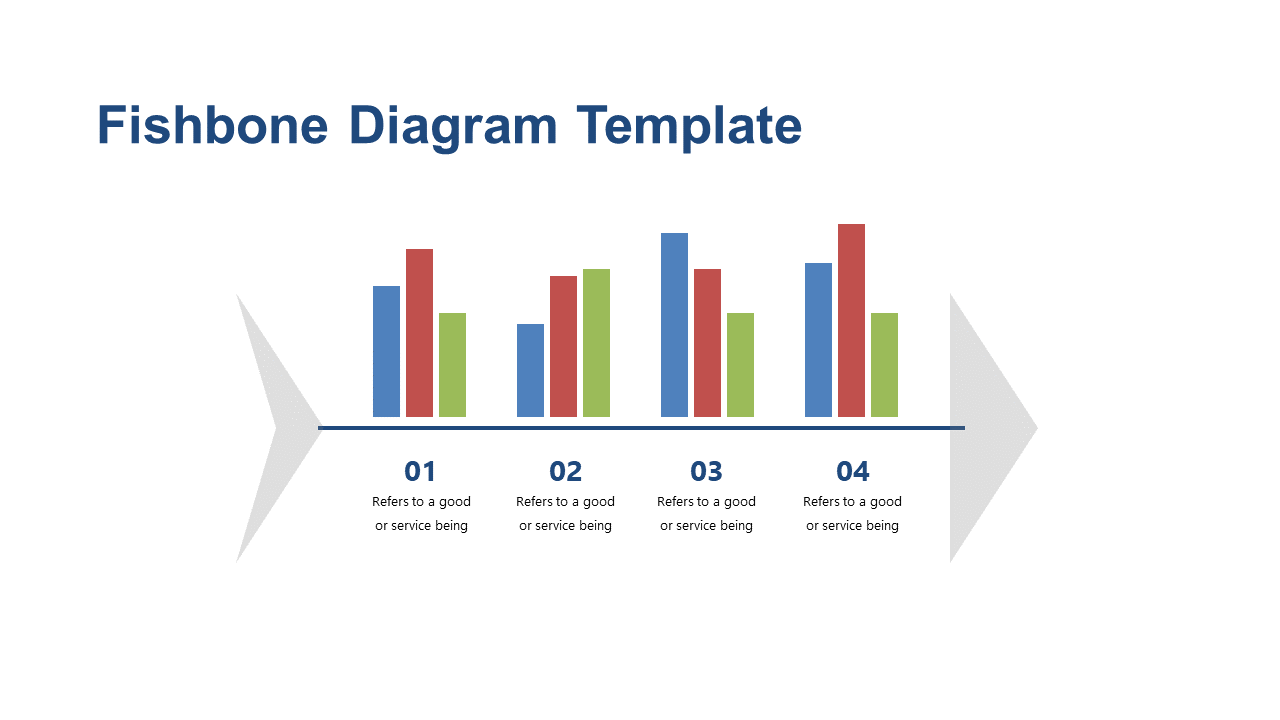
Understanding the underlying causes of issues can feel daunting, especially in complex projects where every detail matters. This well-structured Fishbone Diagram slide provides a clear visual method for mapping out contributing factors, helping you make sense of complicated situations.
Project managers, product designers, and business development teams will benefit greatly from this slide during root cause analysis sessions. It serves as an essential tool for organizing discussions and identifying key areas for improvement, ensuring that your team stays on track.
Download this editable Fishbone Diagram slide now for only $0.99. It’s ready for quick edits in both PowerPoint and Google Slides, making it easy for you to adapt it to your specific needs within minutes.
$0.99 – Purchase Checkout
Added to cart







