Effective Cause and Effect Analysis with Fishbone Diagram
Product Description
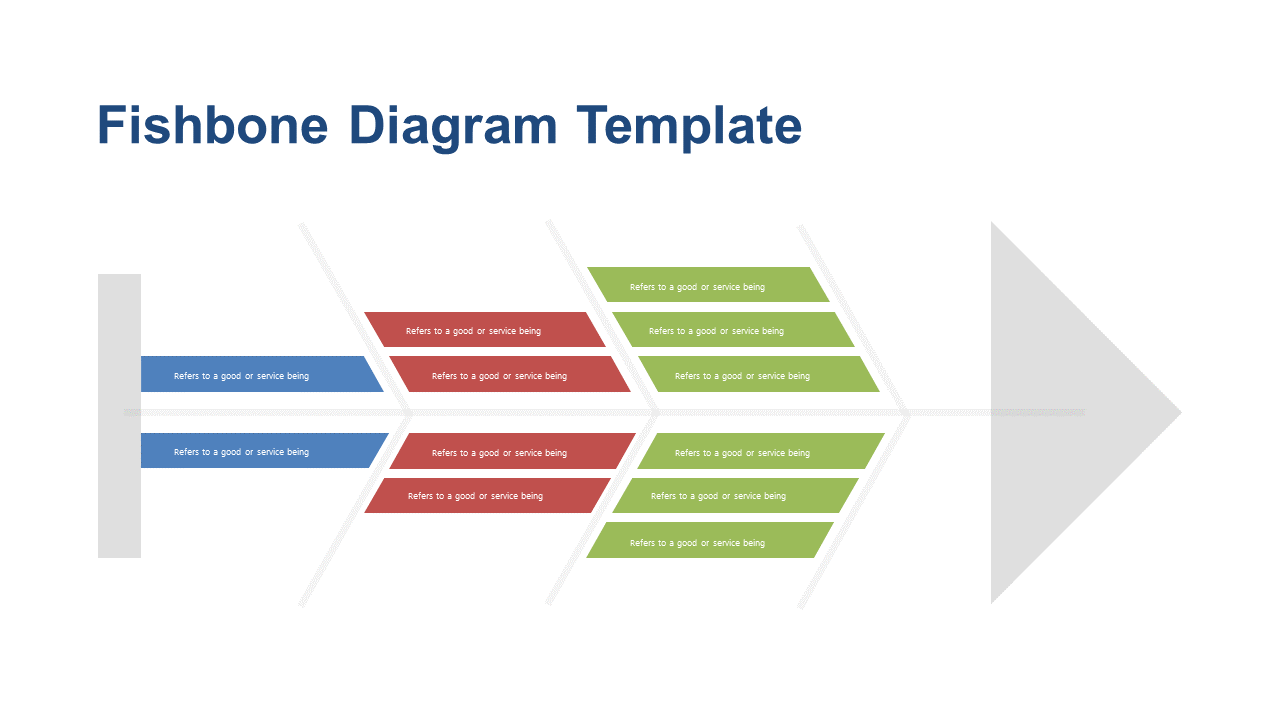
In a fast-paced environment, pinpointing the root causes behind operational issues can feel overwhelming. This Fishbone Diagram provides a visual structure that simplifies the analysis process, helping you and your team identify key factors contributing to a problem without the stress of disorganized thoughts.
Operations managers, process improvement specialists, and team leaders in manufacturing will find this slide invaluable during root cause analysis meetings. It’s designed to facilitate discussions that help clarify complicated issues, enabling teams to make informed decisions quickly and effectively.
At just $0.99, you can download this Fishbone Diagram slide instantly, ready for editing in both PowerPoint and Google Slides. Its intuitive layout allows you to make adjustments in no time, so you can focus on solving problems rather than designing slides.
$0.99 – Purchase Checkout
Added to cart