Analyze Products with Fishbone Diagram Template
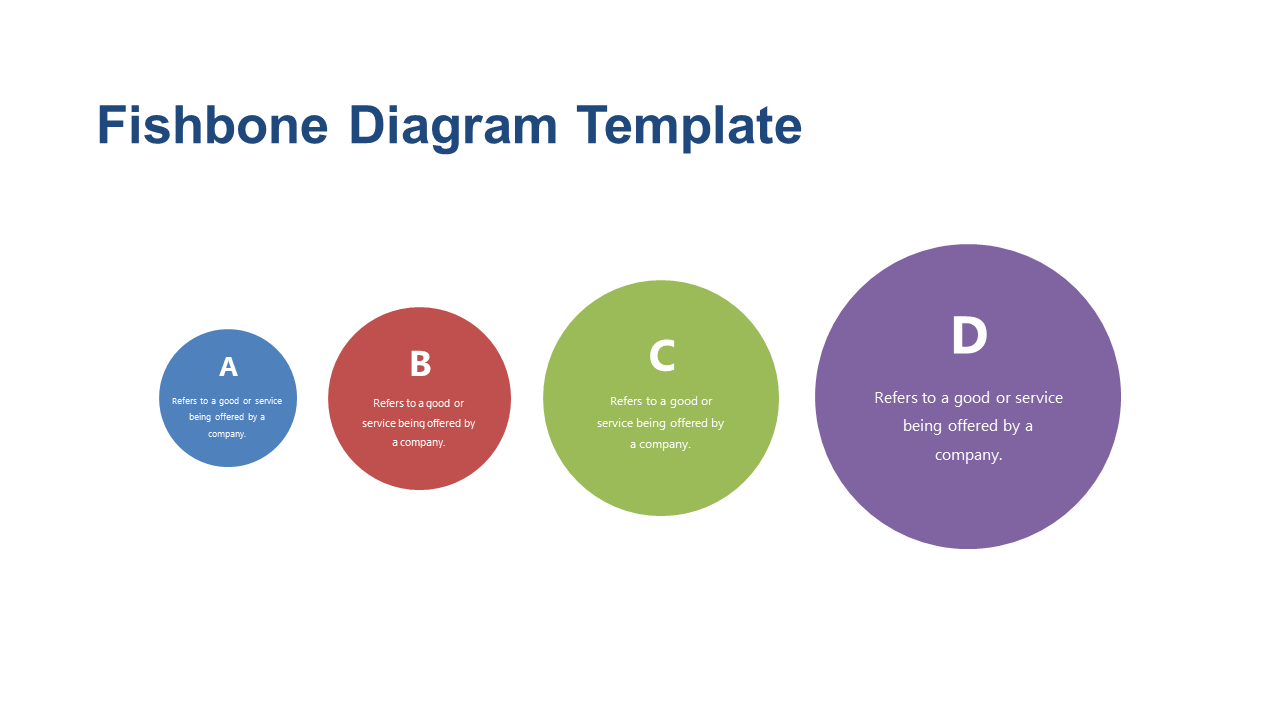
Product Description
Analyzing products can often leave you feeling lost in a sea of data and unclear about what’s truly affecting your outcomes. With this Fishbone Diagram slide, you’ll have a powerful visual tool at your fingertips to break down complex issues and pinpoint root causes with clarity.
It’s designed to help you illustrate relationships and identify improvement opportunities effectively. Quality managers in manufacturing or product development teams will find this slide particularly useful during root cause analysis meetings. Whether you’re presenting findings from a product review or facilitating a brainstorming session with your team, this diagram helps organize thoughts and encourages collaborative problem-solving.
For just $0.99, you can easily download this slide and customize it in PowerPoint or Google Slides. Editing is straightforward, allowing you to tailor it to your specific needs in just minutes.
$0.99 – Purchase Checkout
Added to cart







