SlideSwift
By Category
💼Business 📊Infographics □Minimal 🕐Timelines ✨Neumorphic 🗑Diagrams 🔄Flow Charts ✨Glassmorphism 🎨Creative 🌍Abstract 🔄Cycle Diagrams 💎Isometric 🖼Illustrations 📱Social Media 🗺MapsBy Slide Type
🚀Pitch Deck 📌Roadmap 🔍SWOT Analysis 📅Timeline 📈Gantt Chart 🏢Org Chart 📋Funnel ⚖Comparison 📄Case Study 📋Agenda ⭐Icons & Lists 👏Thank You
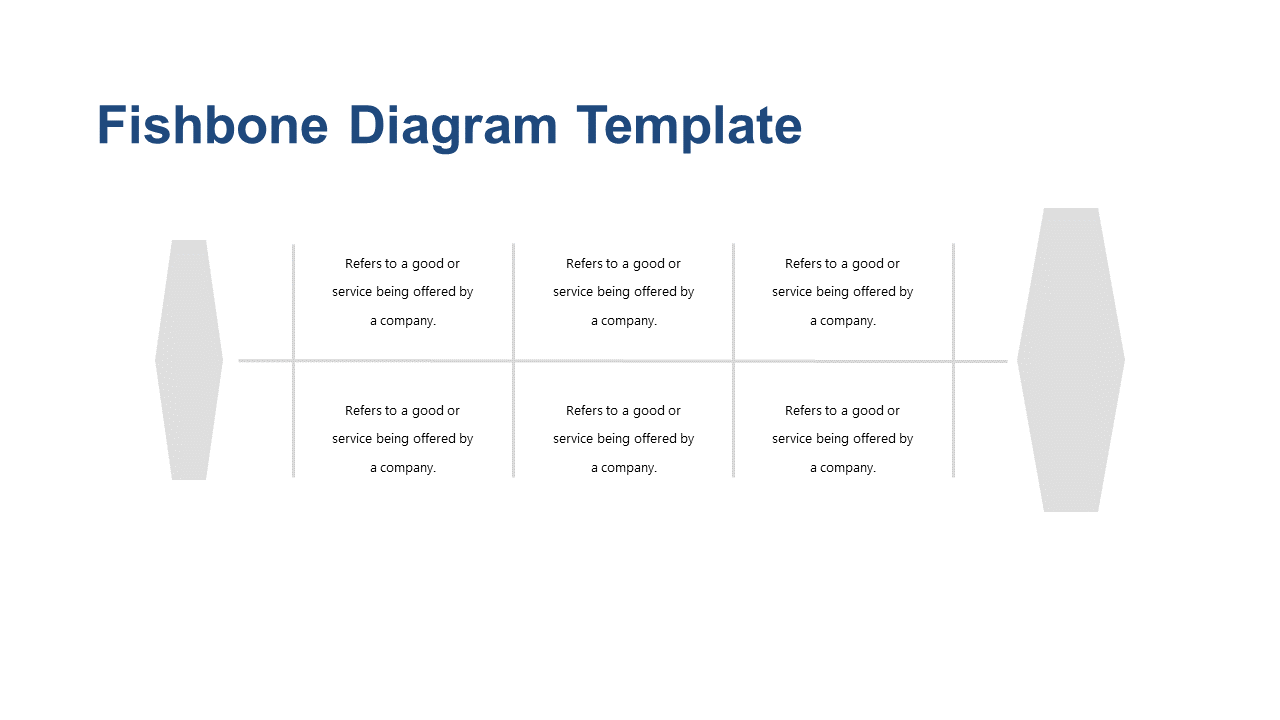
Identifying the root causes of persistent issues can be a daunting task for many professionals. The Fishbone Diagram slide provides a clear and structured visual that helps teams dissect problems into manageable parts. With labeled sections, this diagram allows users to categorize potential causes systematically, making it an essential tool for quality management and process improvement. An operations manager can use this slide to facilitate team discussions, ensuring everyone contributes to the analysis of challenges. A business analyst might employ this diagram in a client presentation to demonstrate how various factors interact and lead to specific issues, enhancing understanding and collaboration. Meanwhile, an architect could leverage this slide during project planning to evaluate potential design flaws and their implications, ensuring a smoother execution phase. This slide is easy to customize; simply edit the sections to fit your specific problem areas. $0.99 — add this single slide to any deck from the SlideSwift Slide Library. No subscription needed. Mix slides from any category to build your perfect deck.
Add more from this category to your custom deck