Compare Products with Horizontal Flow Chart
Product Description
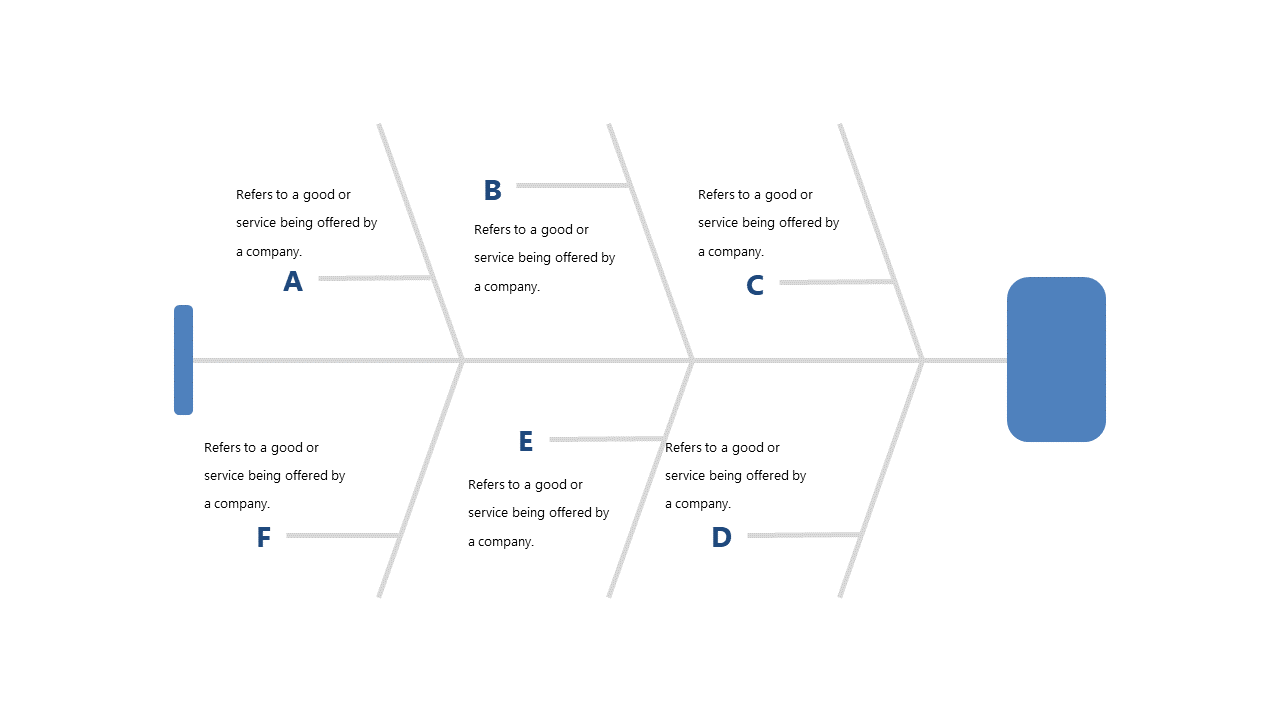
When comparing products, trying to showcase all the differences without a clear visual can lead to confusion and missed opportunities. This horizontal flow chart slide makes it straightforward to present multiple options side by side, helping your audience quickly understand distinctions between products or services.
Ideal for sales representatives comparing product features during client meetings or marketing teams evaluating various campaigns, this slide can also assist project managers comparing software tools. No matter the context, this visual guide ensures clarity and informed decision-making.
At just $0.99, you can download this slide instantly and edit it easily in PowerPoint or Google Slides. Make your product comparisons stand out and engage your audience effectively with this user-friendly flow chart.
$0.99 – Purchase Checkout
Added to cart







