Analyze Problems with Fishbone Diagram Template
Product Description
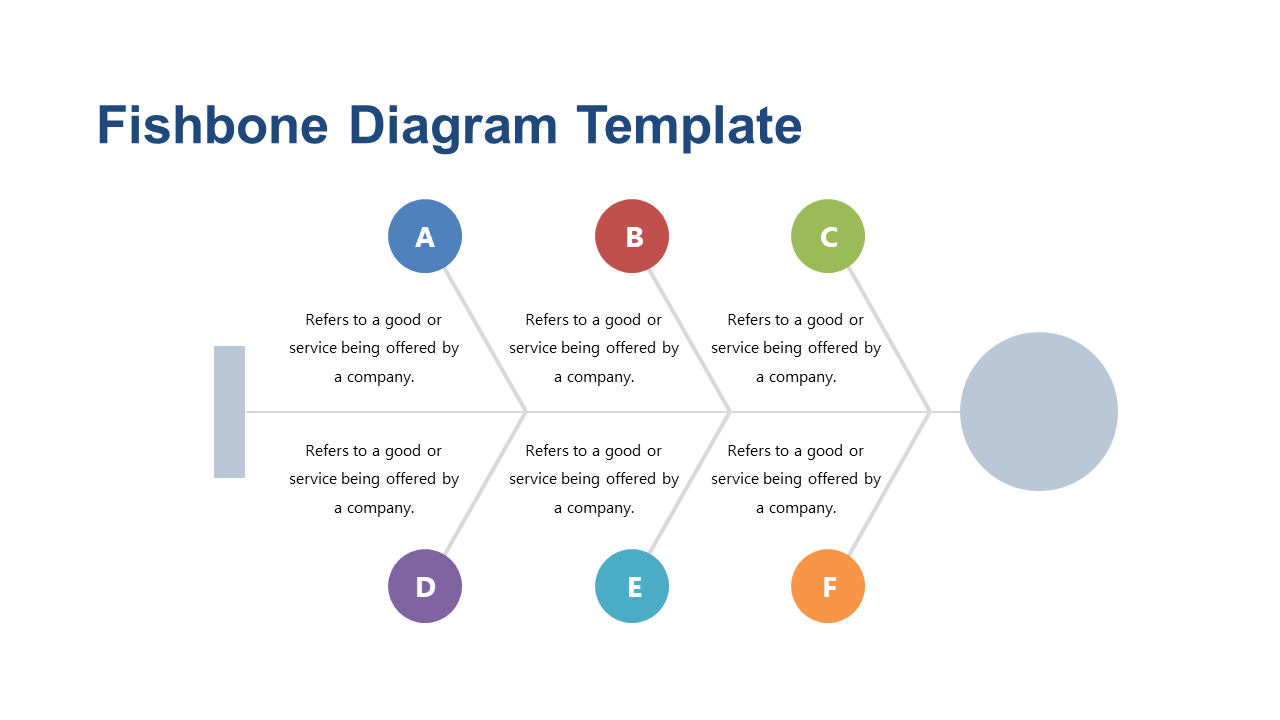
When faced with a series of interrelated issues, figuring out the root cause can become a complex puzzle. The Fishbone Diagram slide serves as an effective visual tool to break down these complexities into manageable parts, facilitating a clearer understanding of underlying causes.
You’ll find this slide indispensable in healthcare settings, such as when quality improvement teams analyze patient care issues, or for IT professionals troubleshooting system errors during team meetings. It’s designed for consultants presenting findings to clients or educators guiding students through problem-solving frameworks.
Available for just $0.99, this slide is an instant download compatible with both PowerPoint and Google Slides. Quickly edit it to fit your specific needs and enhance your problem-solving discussions effortlessly.
$0.99 – Purchase Checkout
Added to cart







