SlideSwift
By Category
💼Business 📊Infographics □Minimal 🕐Timelines ✨Neumorphic 🗑Diagrams 🔄Flow Charts ✨Glassmorphism 🎨Creative 🌍Abstract 🔄Cycle Diagrams 💎Isometric 🖼Illustrations 📱Social Media 🗺MapsBy Slide Type
🚀Pitch Deck 📌Roadmap 🔍SWOT Analysis 📅Timeline 📈Gantt Chart 🏢Org Chart 📋Funnel ⚖Comparison 📄Case Study 📋Agenda ⭐Icons & Lists 👏Thank You
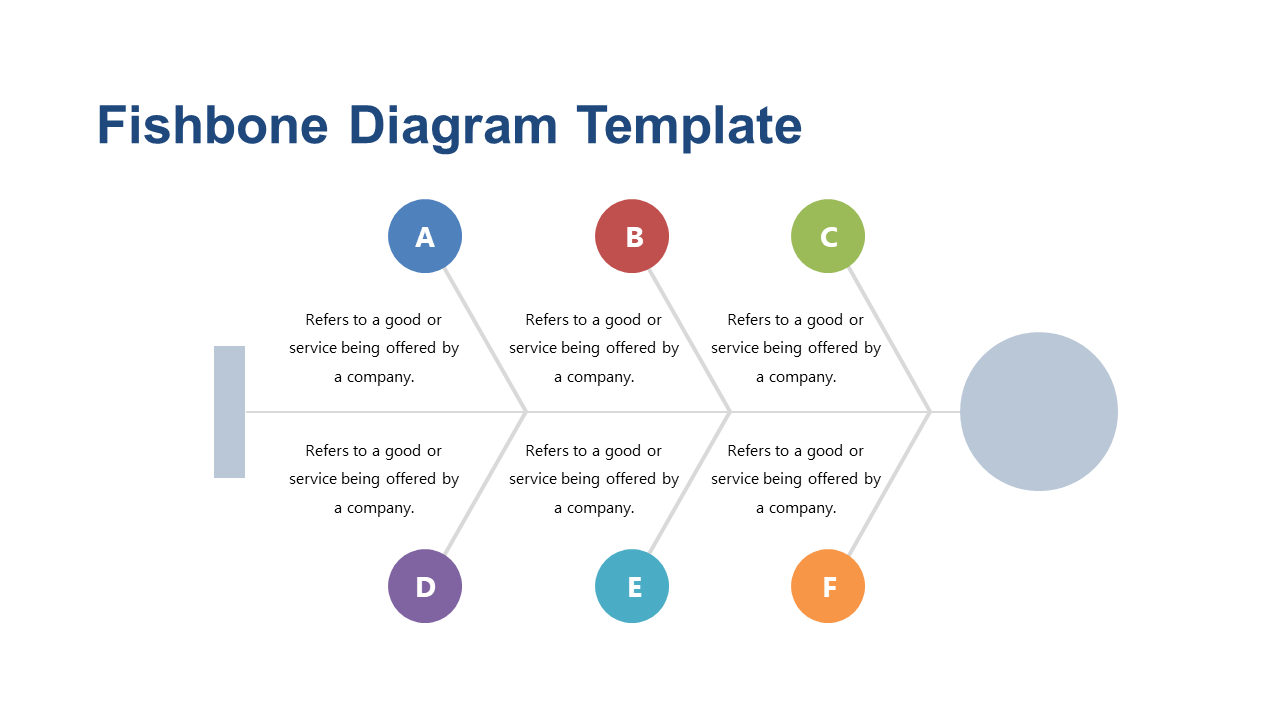
In meetings, identifying the root cause of a problem can often become a daunting task, especially when multiple factors are at play. This Fishbone Diagram slide is designed to visually break down complex issues into manageable components, allowing for clearer analysis and discussion. The layout presents a structured way to categorize causes, making it easier for your audience to engage and contribute. For consultants, this slide is perfect during client workshops to facilitate deeper discussions around challenges. Operations managers can use it to streamline processes by identifying inefficiencies and areas for improvement. Business analysts will find it invaluable when presenting data-driven insights that require a thorough examination of underlying causes. The slide is fully customizable, allowing you to tailor it to your specific content and branding. $0.99 — add this single slide to any deck from the SlideSwift Slide Library. No subscription needed. Mix slides from any category to build your perfect deck.
Add more from this category to your custom deck