SlideSwift
By Category
💼Business 📊Infographics □Minimal 🕐Timelines ✨Neumorphic 🗑Diagrams 🔄Flow Charts ✨Glassmorphism 🎨Creative 🌍Abstract 🔄Cycle Diagrams 💎Isometric 🖼Illustrations 📱Social Media 🗺MapsBy Slide Type
🚀Pitch Deck 📌Roadmap 🔍SWOT Analysis 📅Timeline 📈Gantt Chart 🏢Org Chart 📋Funnel ⚖Comparison 📄Case Study 📋Agenda ⭐Icons & Lists 👏Thank You
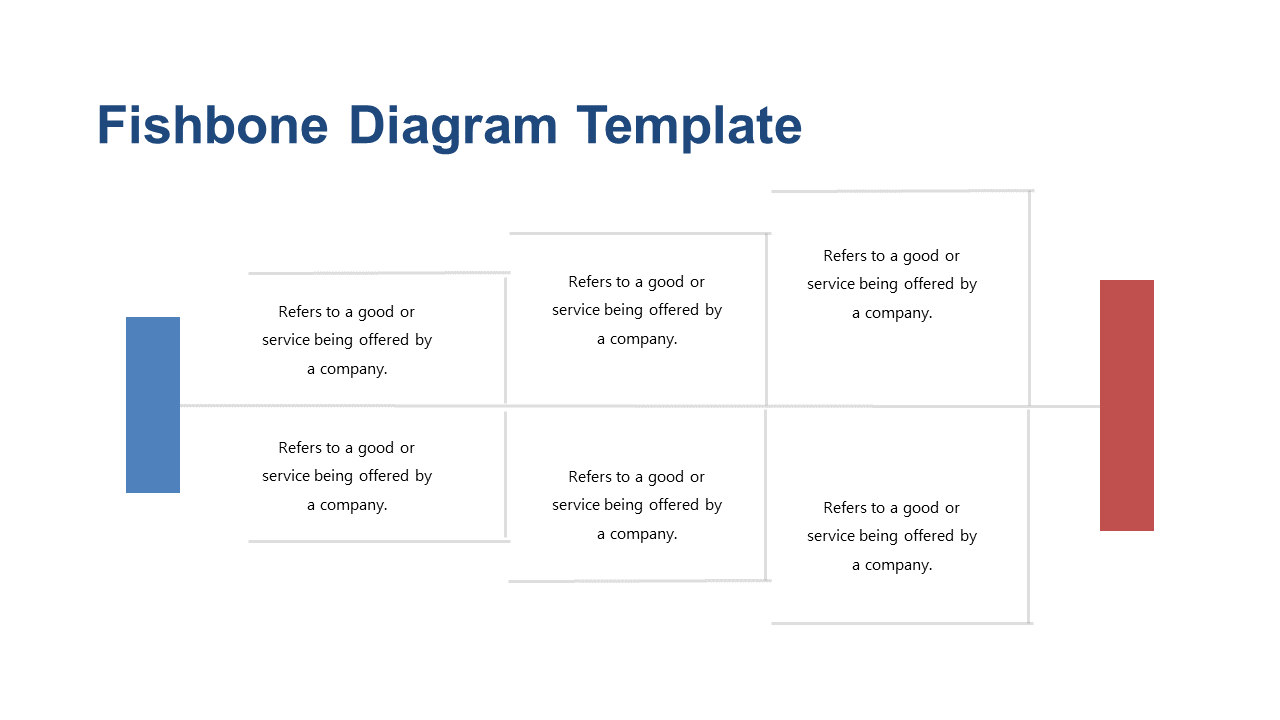
Identifying the root causes of problems can be a daunting task for any team, especially when the stakes are high. This Fishbone Diagram slide provides a clear and organized visual representation, allowing you to categorize various potential causes effectively. With its easy-to-edit labels, you can quickly tailor the slide to focus on your specific issue, whether it’s a quality control problem or a production bottleneck. For operations managers, this slide streamlines the process of presenting findings in team meetings, making discussions more focused and productive. Business analysts will find it invaluable for data-driven presentations, as it helps to visually communicate insights and recommendations. Architects can utilize this diagram to dissect complex project challenges, presenting a systematic approach to problem-solving. Customizing the slide to fit your unique context is straightforward and can enhance the impact of your presentation. $0.99 — add this single slide to any deck from the SlideSwift Slide Library. No subscription needed. Mix slides from any category to build your perfect deck.
Add more from this category to your custom deck