Showcase Decision Points with a Decision Tree Layout
Product Description
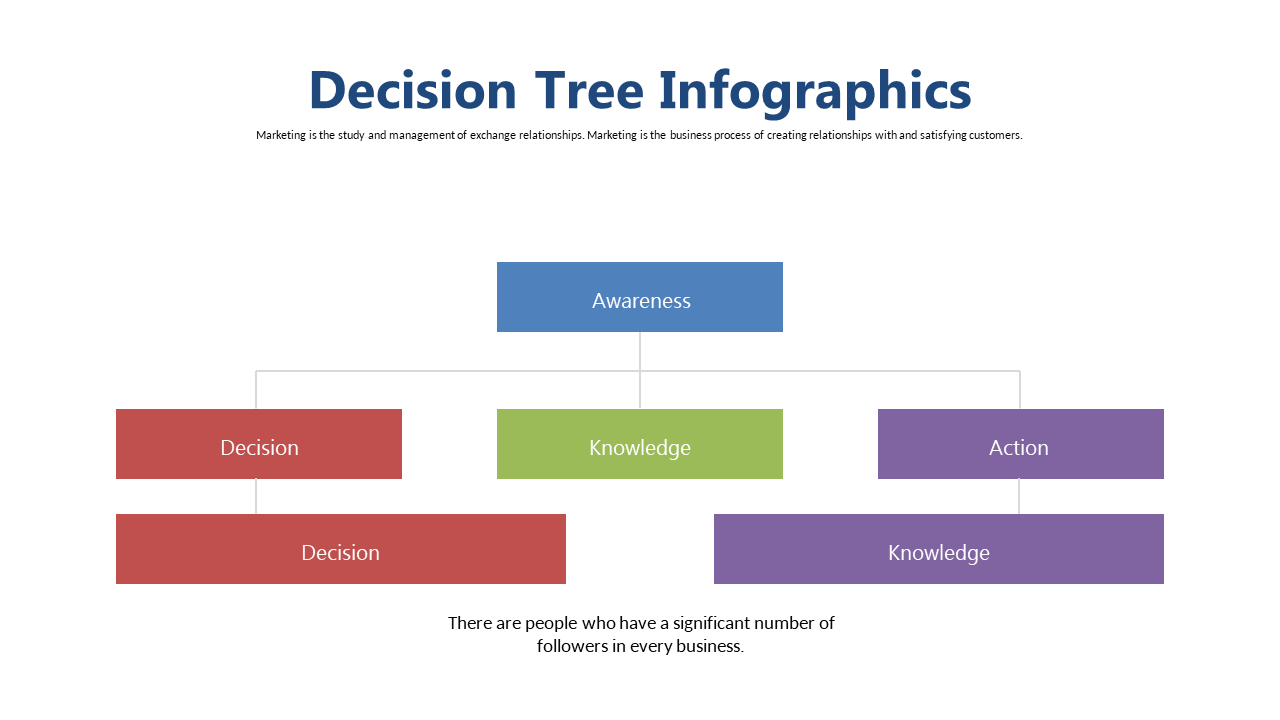
When you’re a business analyst, accurately communicating decision points is critical for project success. This slide presents a well-structured decision tree layout, designed specifically to illustrate relationships and pathways in your decision-making process. It allows your audience to grasp complex choices quickly and clearly.
Consider using this slide during stakeholder meetings or project kickoff sessions, where you need to clarify how decisions impact outcomes. By implementing this slide, you’ll help ensure that everyone involved comprehends the critical paths and options.
The clarity it provides can help drive more informed discussions and decisions. For only $0.99, you can download this slide and start editing it right away in PowerPoint or Google Slides. It’s easy to make adjustments, giving you the flexibility to tailor it to your project needs quickly.
$0.99 – Purchase Checkout
Added to cart







