Visualize Relationships with a Decision Tree Infographic
Product Description
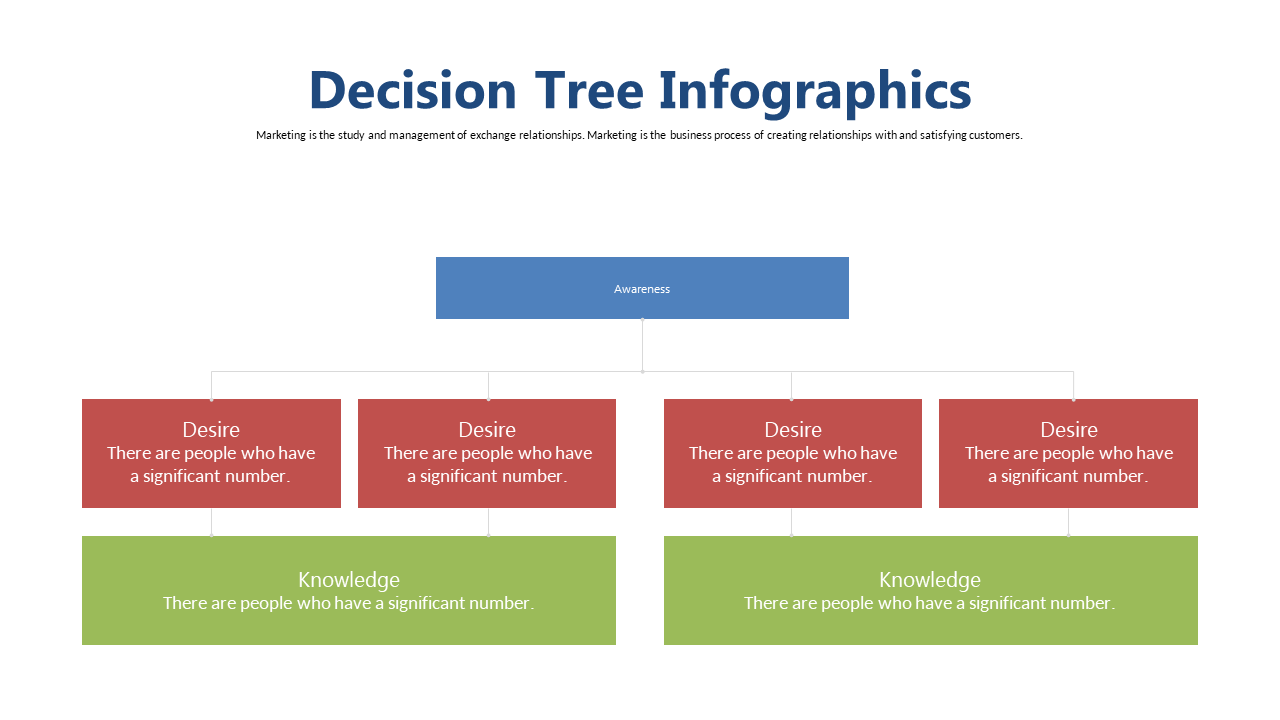
Conveying complex relationships can be quite a challenge in today’s fast-paced business world. Operations managers, for instance, often struggle to present decision-making processes in a straightforward manner. This decision tree infographic addresses that challenge, clearly breaking down information so that it’s easy for your audience to grasp.
Imagine using this slide during a project overview or strategy discussion, where clarity is key. It’s designed to help roles such as operations managers and team leads effectively communicate intricate decisions to their audiences, ensuring that everyone understands the various pathways and implications involved. The visual nature of this slide makes it an essential tool for impactful presentations.
For the price of $0.99, you can quickly download this slide and modify it in PowerPoint or Google Slides to fit your presentation style. Its user-friendly design means
you can customize it effortlessly and have it ready to go in minutes.
$0.99 – Purchase Checkout
Added to cart