Customer Value Proposition Insights with Venn Diagram V2

Product Description
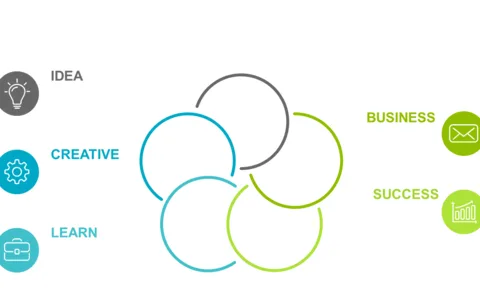
Consultants often struggle to communicate the value proposition of their offerings, leaving clients confused about the benefits. This slide addresses that challenge by providing a clear Venn diagram that illustrates the overlapping interests of your company, your competitors, and your customers, making complex relationships easier to understand.
You’ll find this slide useful in various settings, from strategy discussions to client presentations, especially when you’re trying to clarify how your solution stands out in a competitive landscape. It’s perfect for business consultants, marketing specialists, or anyone involved in client-facing discussions where clear communication of value is essential.
For just $0.99, you can instantly download this editable slide, which works seamlessly in both PowerPoint and Google Slides. You’ll be able to customize it to fit your needs within minutes.
$0.99 – Purchase Checkout
Added to cart