Explore Customer Value Proposition with Venn Diagram
Product Description
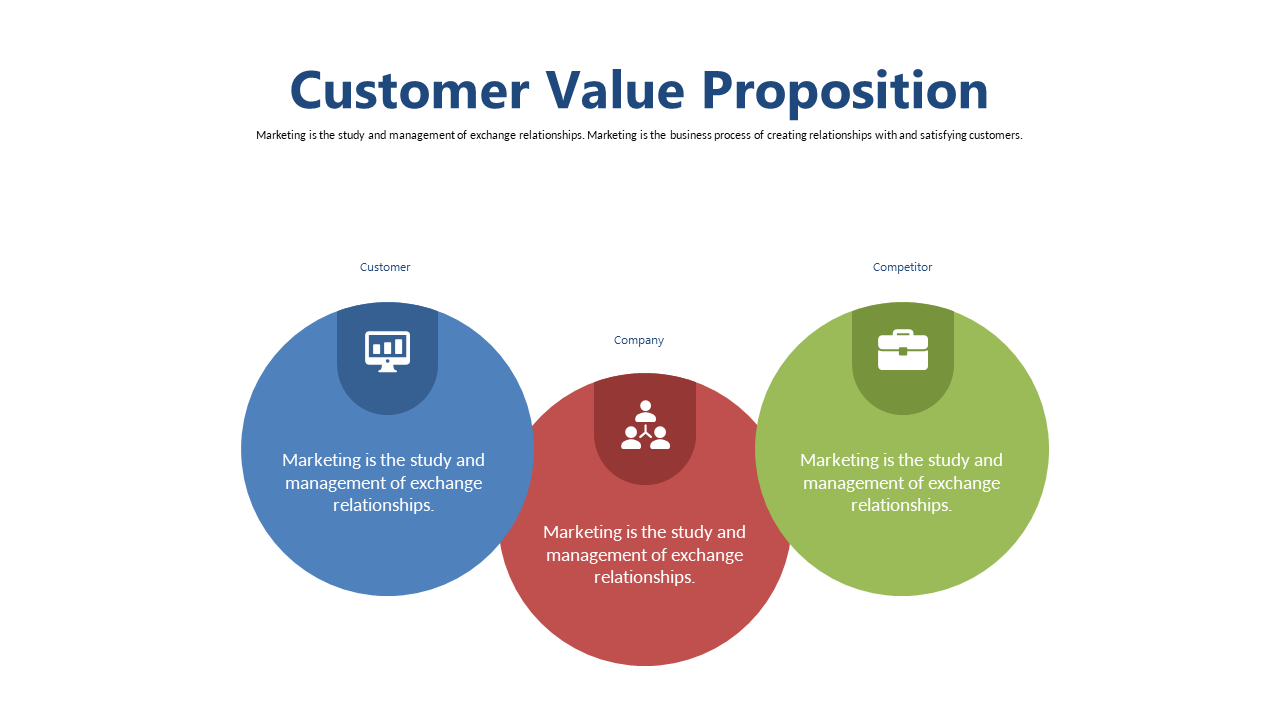
Grasping the intricacies of the customer value proposition can be particularly challenging when you need to address both your offerings and those of competitors. This Venn Diagram simplifies that complexity, presenting a clean visual that outlines the essential interactions among customers, your company, and the competition.
You might find this slide useful as a business analyst during market assessments, a product marketing manager presenting features to a sales team, or a consultant helping clients navigate competitive landscapes. It’s perfect for discussions that require visual clarity on customer interactions.
Available for just $0.99, this slide can be downloaded instantly and is easy to modify. Whether you’re using PowerPoint or Google Slides, you can quickly prepare a professional presentation that resonates with your audience.
$0.99 – Purchase Checkout
Added to cart