Conduct Root Cause Analysis with Fishbone Diagram
Product Description
As an operations manager, pinpointing root causes behind efficiency issues can feel like a monumental task. A structured visual format is essential for breaking complex problems down into manageable components.
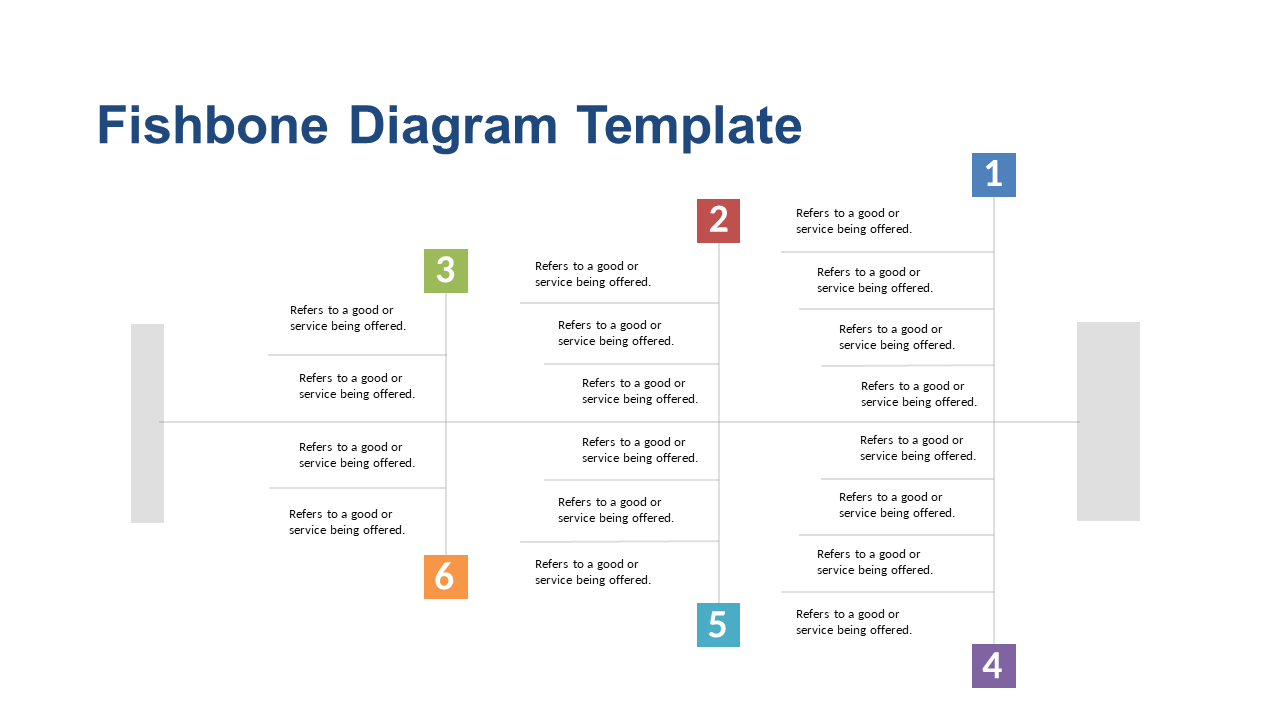
This Fishbone diagram slide offers a clean layout that aids in systematically identifying issues. Use this diagram during operational reviews or when conducting team workshops focused on improving processes. For instance, if you’re analyzing delays in production, this tool will help you map out various factors that contribute to inefficiencies, making discussions with your team more productive.
Available for just $0.99, this slide can be downloaded instantly and is editable in both PowerPoint and Google Slides. You’ll be ready to present your findings in minutes, ensuring you stay on track with your analysis.
$0.99 – Purchase Checkout
Added to cart







