Collaborate on Issues with Fishbone Diagram V4
Product Description
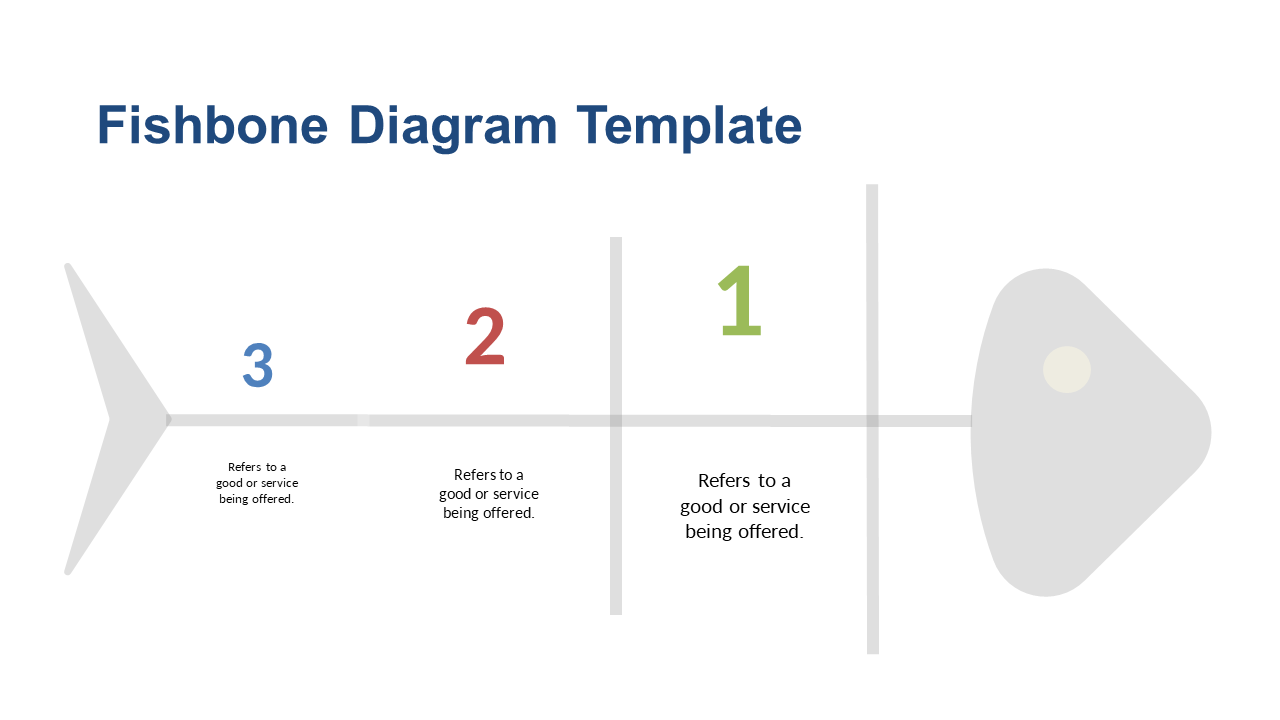
When dealing with complicated issues, having a clear visual can transform how your team approaches problem-solving. The Fishbone Diagram helps you and your colleagues dissect problems in a structured way, making it easier to identify various causes.
This slide is particularly beneficial for product teams brainstorming challenges in user experience or for service managers addressing customer complaints. Use it in your next collaborative meeting to ensure everyone is on the same page.
At a low price of only $0.99, you can download this slide immediately. It’s easily customizable in PowerPoint and Google Slides, allowing you to start improving discussions right away.
$0.99 – Purchase Checkout
Added to cart
✅ Instant delivery
✅ Fully editable
✅ PowerPoint & Google Slides
Category:
$0.99
Per slide · No minimum · Pay only for what you pick
✓ $0.99/slide
No minimum order
✓ Mix any category
No subscription
Building a full deck?
Mix slides from any of our 58 categories —
all merged into one PowerPoint.
$0.99/slide, no minimum.
Browse All Slides →







