Map Causes with Fishbone Diagram Analysis Template
Product Description
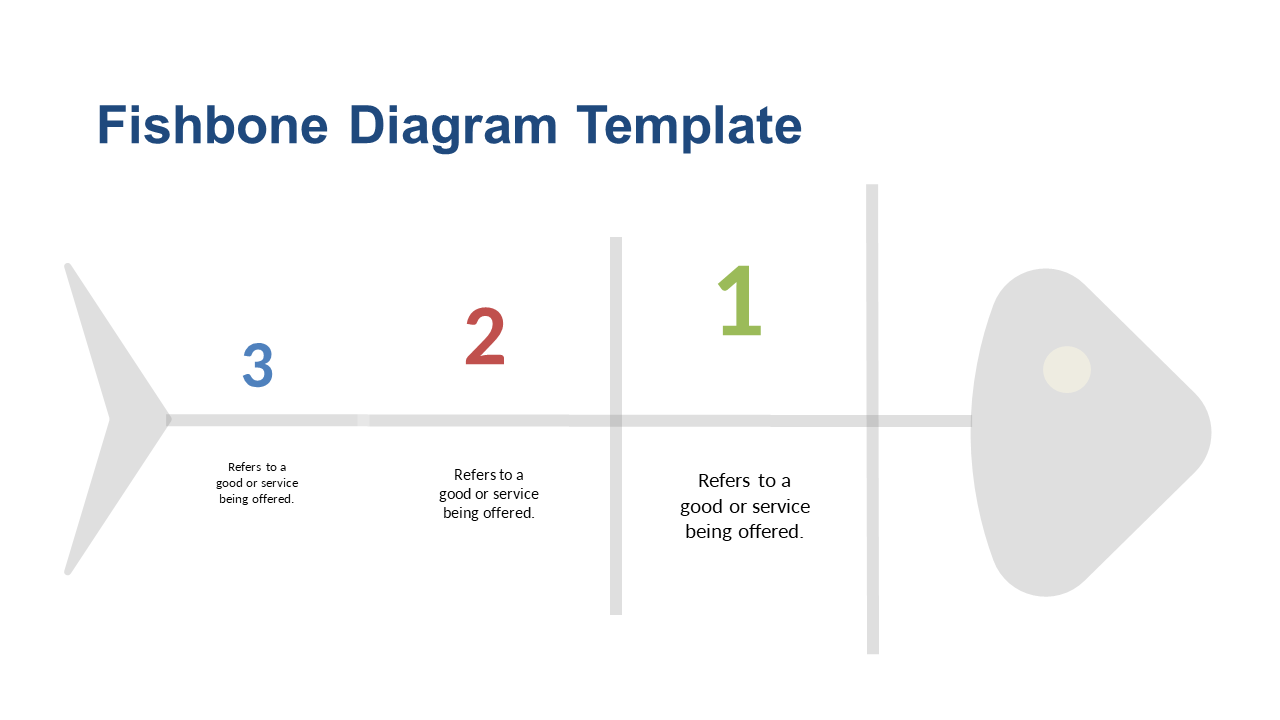
Getting to the root of complex operational problems can be daunting for managers. The Fishbone Diagram offers a clear format for mapping out potential causes, giving you and your team a visual advantage during problem-solving sessions.
Operations managers in manufacturing can use this slide to identify production delays, while IT managers can benefit when analyzing system outages. It’s an invaluable tool for workshops and strategy sessions where clarity is crucial.
For just $0.99, this slide is yours to download instantly. It’s easy to edit in PowerPoint and Google Slides, getting you closer to your solution in no time.
$0.99 – Purchase Checkout
Added to cart
✅ Instant delivery
✅ Fully editable
✅ PowerPoint & Google Slides
Category:
$0.99
Per slide · No minimum · Pay only for what you pick
✓ $0.99/slide
No minimum order
✓ Mix any category
No subscription
Building a full deck?
Mix slides from any of our 58 categories —
all merged into one PowerPoint.
$0.99/slide, no minimum.
Browse All Slides →







