Showcase Growth with Tree Design Infographic
Product Description
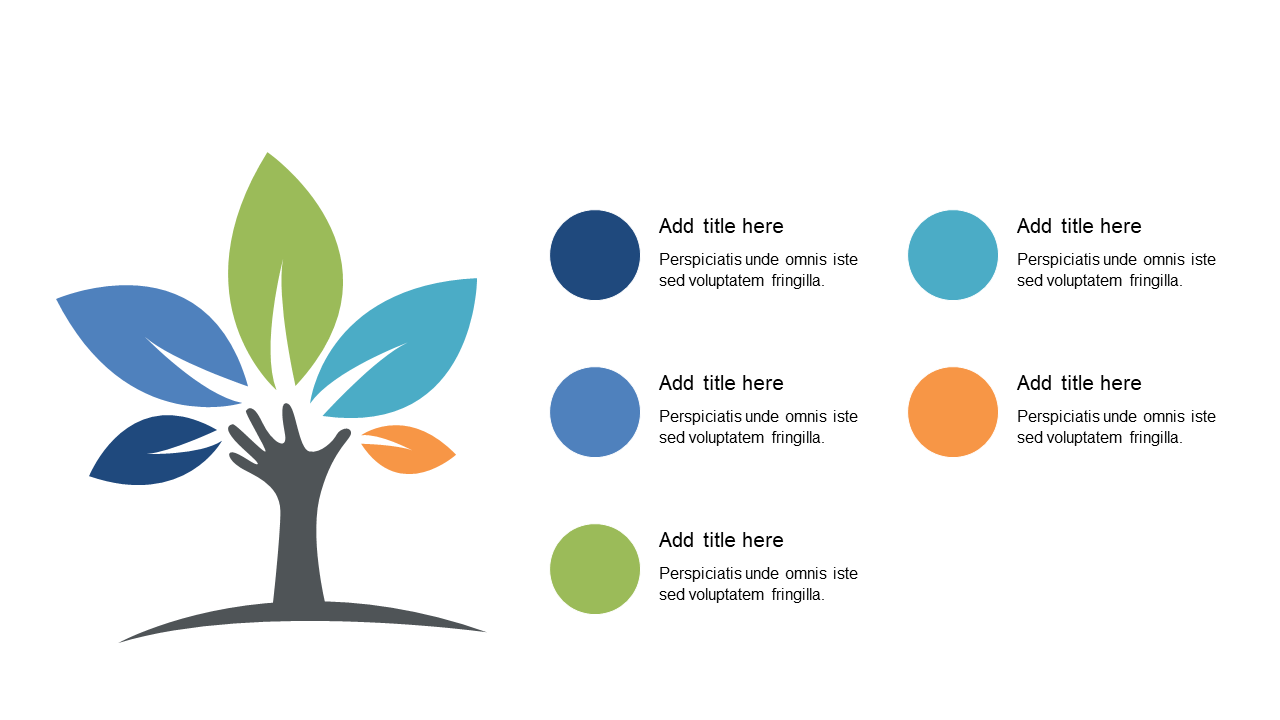
Finding a way to present growth figures that truly resonate can be a challenge. This slide, featuring a tree design infographic, offers a fresh visual approach to highlight your key achievements and strategies. It’s perfect for grabbing attention and making your message stick, helping your audience connect the dots on growth trajectories.
This tree infographic is ideal for sales directors presenting quarterly results, or business analysts detailing growth patterns in an annual review meeting. You can also use it during marketing strategy sessions, allowing you to display growth initiatives to stakeholders in an engaging format.
The design invites discussion and clarity, making your presentation stand out. At just $0.99, this slide is available for instant download, so you can start using it right away. It’s easy to edit in both PowerPoint and Google Slides, allowing you to customize the content to fit your presentation in no time.
$0.99 – Purchase Checkout
Added to cart







