Illustrate Earnings with Horizontal Steps
Product Description
Clearly presenting earnings data can feel like a high-stakes challenge, especially when clarity is essential. Many presentations fail to convey growth metrics effectively, leaving audiences confused.
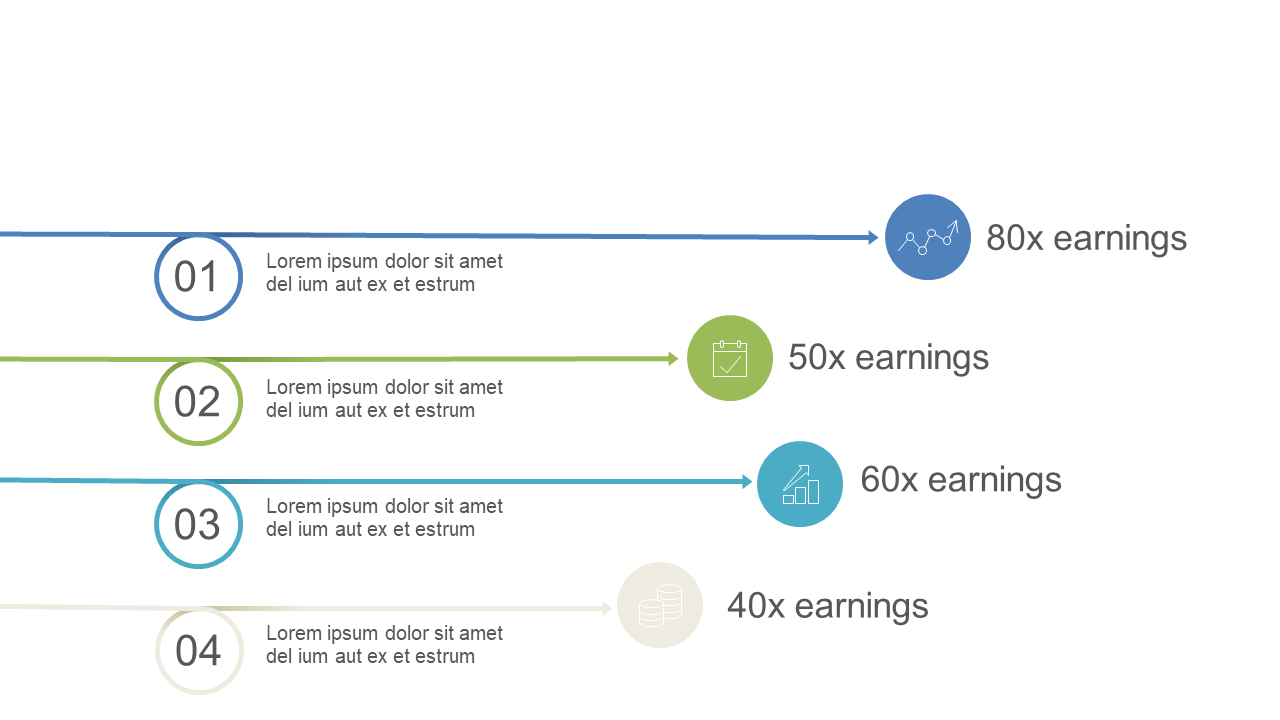
This horizontal step slide offers a straightforward way to layout your earnings indicators, ensuring that your information resonates. This slide is particularly useful for finance professionals preparing quarterly earnings reports, business development teams pitching growth strategies, or executives updating stakeholders on financial health. You can use it in board meetings, investor presentations, or even team reviews focused on financial performance.
Available for only $0.99, this slide can be downloaded instantly and is easily customizable in both PowerPoint and Google Slides. You’ll be able to adjust it to match your specific earnings data quickly and effortlessly.
$0.99 – Purchase Checkout
Added to cart







