Visualize Data with 3D Circular Diagram
Product Description
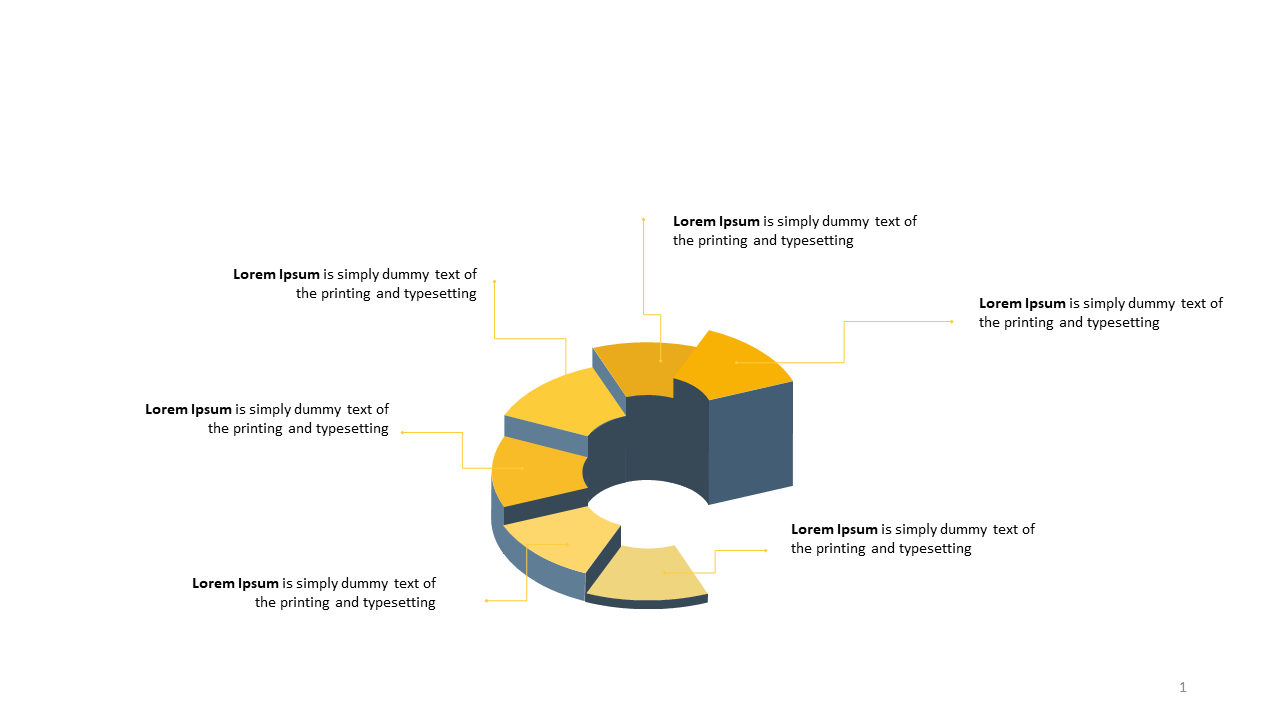
Translating complex data into digestible information can be a real struggle, especially when you need your audience to grasp essential insights quickly. This 3D circular diagram helps you present data segments clearly, allowing viewers to visualize distributions without confusion.
Ideal for data analysts summarizing findings, marketers presenting campaign results, or business strategists analyzing competitive landscapes, this slide caters to various professionals tackling data-heavy discussions. It’s designed to make your points clearer and more compelling.
At just $0.99, this slide is available for instant download and is easily editable in both PowerPoint and Google Slides. You can have it tailored to your presentation in mere minutes, ready to impress your audience.
$0.99 – Purchase Checkout
Added to cart







