Visualize Key Aspects of Business Strategy

Product Description
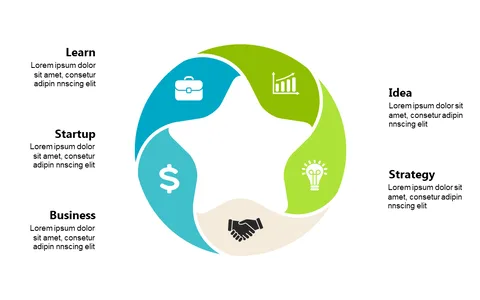
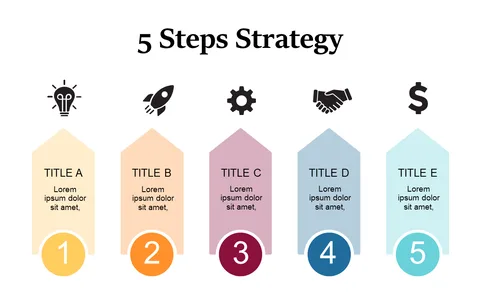
Turning intricate business strategies into digestible visuals can feel daunting, especially when trying to engage your audience. This slide simplifies that challenge with a segmented flow diagram that breaks down key aspects into manageable components.
You can convey market, technology, and competition insights clearly, making it easier for stakeholders to understand your points. Business analysts and strategists will find this slide invaluable during strategy meetings, board presentations, or internal workshops. By providing a clear visual framework, you can keep your team aligned and focused on the main objectives, enhancing your discussions significantly.
Available for just $0.99, this slide is ready for download and customization in minutes. It’s fully editable in PowerPoint and Google Slides, ensuring you can make it your own quickly and without hassle.
$0.99 – Purchase Checkout
Added to cart