Visualize 5-Step Progress with Circular Timeline
Product Description
It’s often tough to convey project milestones in a way that everyone understands. Complicated charts can make it harder for your audience to follow the timeline and grasp progress.
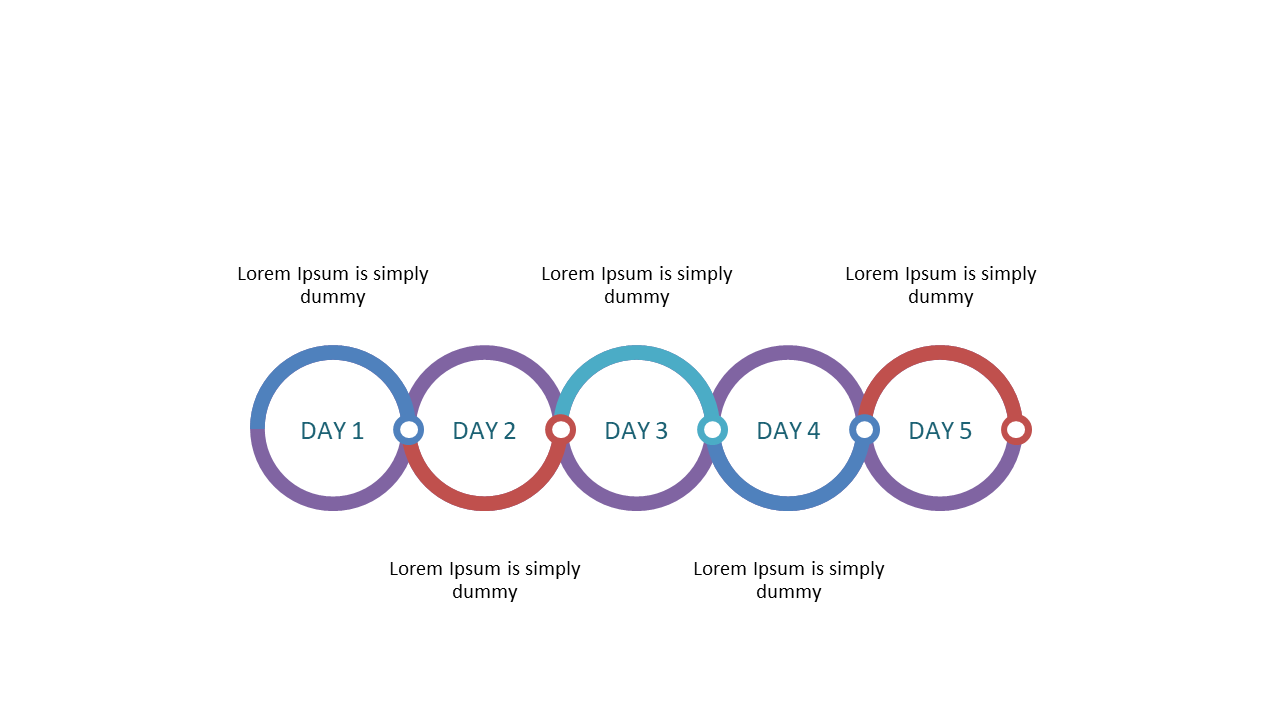
The circular timeline simplifies this process, presenting a clear visual of each step in your project. Project managers across various industries will find this slide invaluable during status meetings, project kick-offs, or quarterly reviews. Whether you’re in tech, construction, or marketing, this layout allows you to effectively communicate where your project stands, helping your team stay aligned and informed.
Available for just $0.99, this slide is ready for instant download and easily editable in PowerPoint or Google Slides. You can modify the steps to fit your specific project while maintaining a professional look.
$0.99 – Purchase Checkout
Added to cart







