COVID-19 Symptoms Flow Chart for Healthcare Education
Product Description
Navigating the communication of COVID-19 symptoms can be tricky, especially when clarity is essential for education and health awareness. If your audience struggles to identify various symptoms quickly, the impact of your message can diminish.
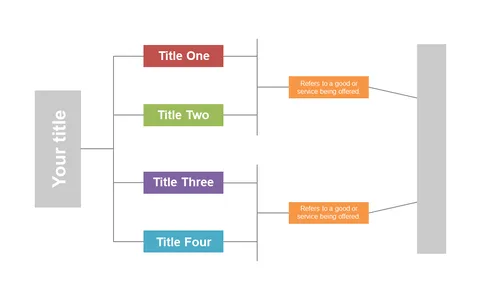
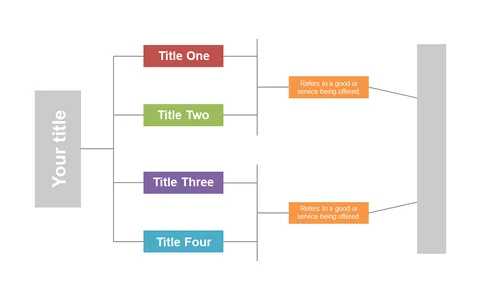
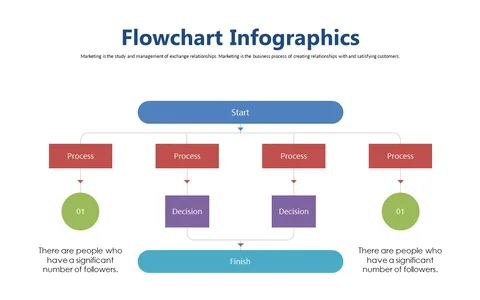
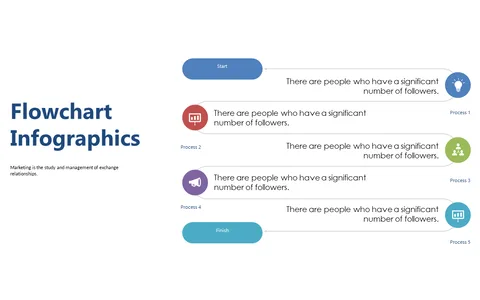
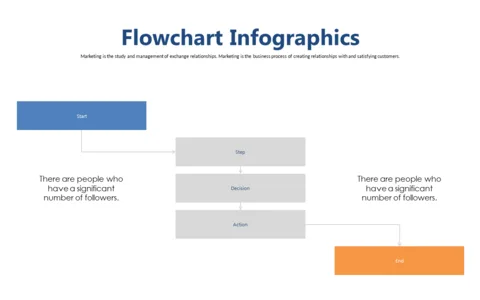
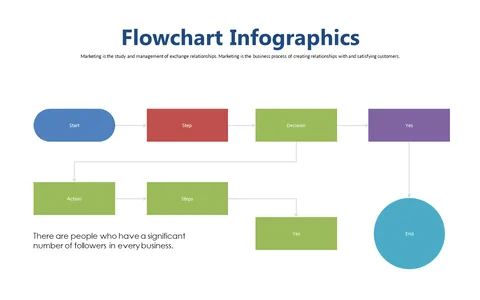
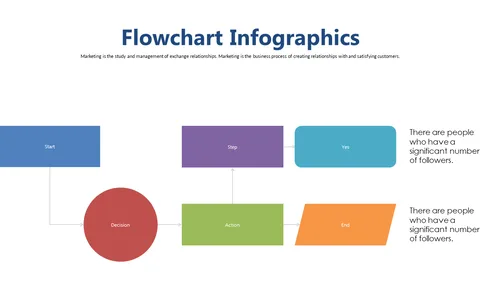
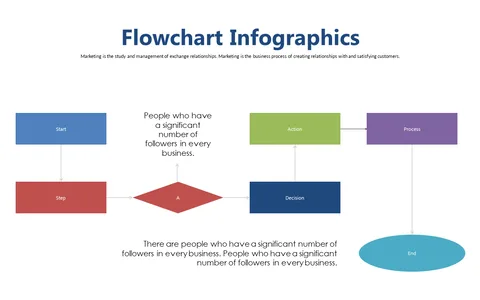
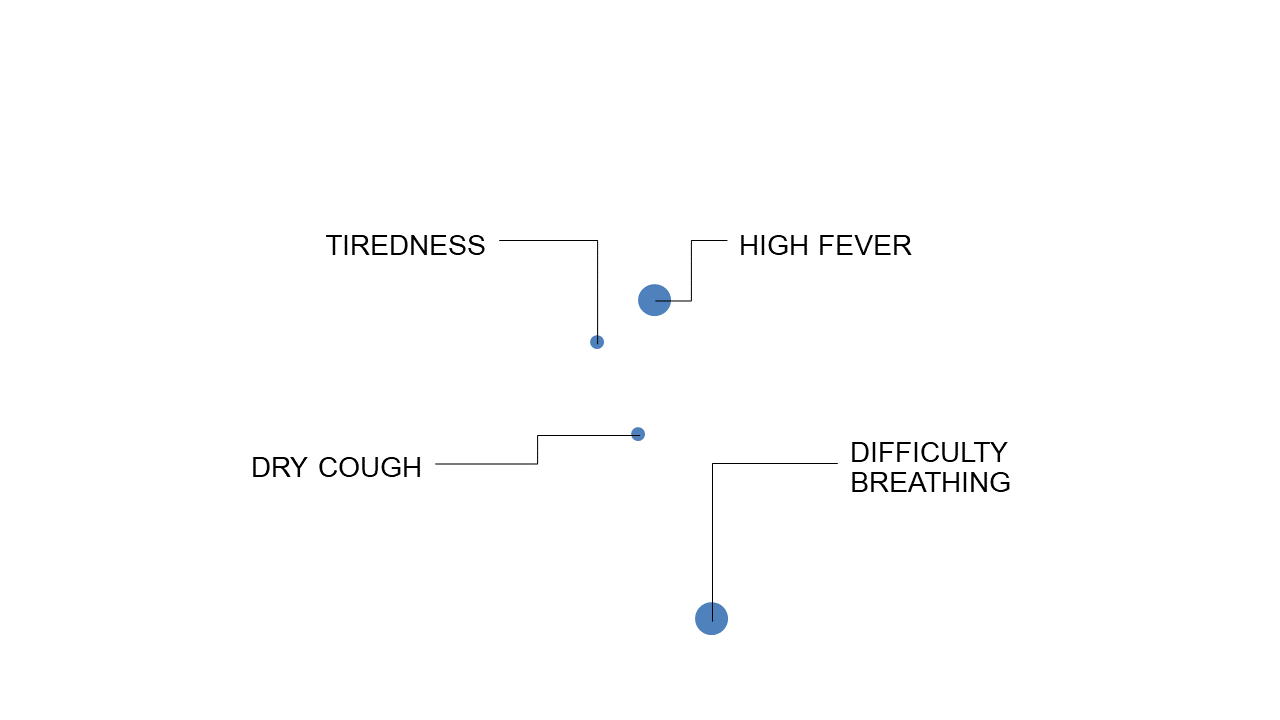
This flow chart simplifies the complexity, visually linking symptoms for easy understanding and awareness. This slide is ideal for healthcare professionals conducting educational seminars, public health officials giving briefings, or educators teaching students about virus symptoms. Whether you’re a doctor, nurse, or health educator, having a visual guide can enhance your ability to inform and educate others about COVID-19 effectively.
For only $0.99, you can download this flow chart and edit it easily in PowerPoint or Google Slides. It’s a quick and simple way to improve your presentations, helping to ensure everyone walks away with the right information.
$0.99 – Purchase Checkout
Added to cart