Categorize Information with Quadrant Circle Diagram
Product Description
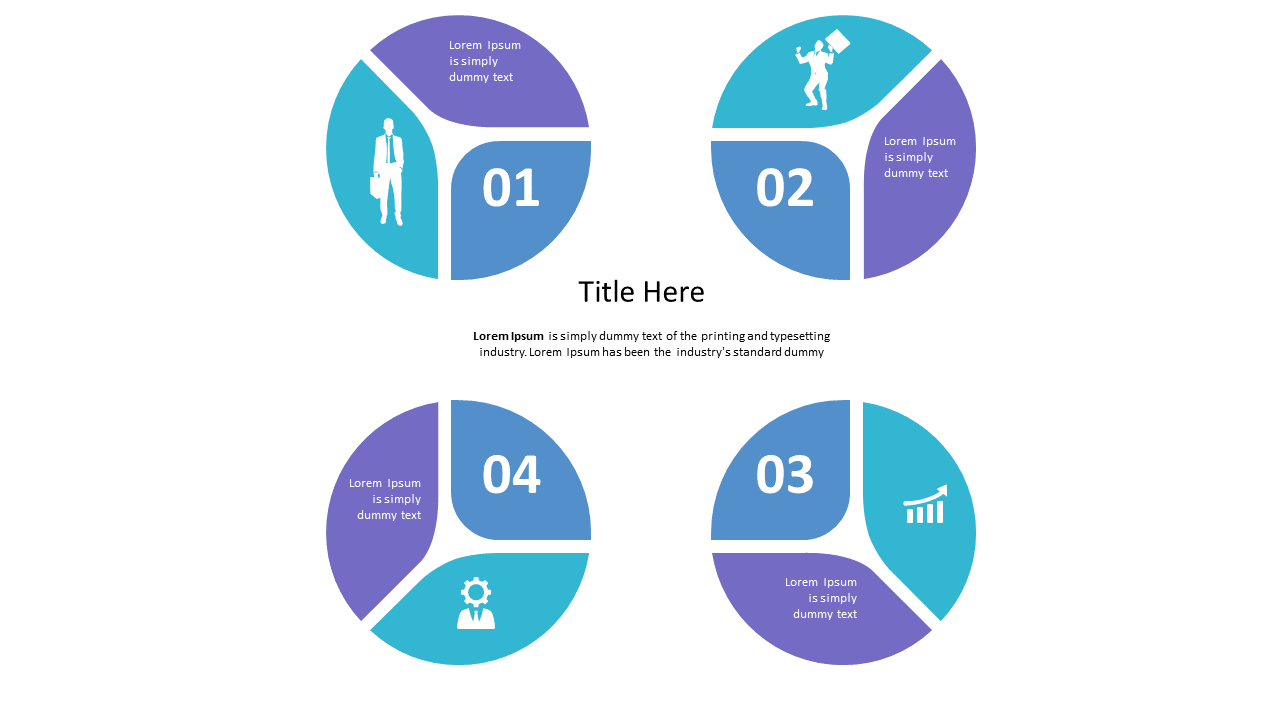
Finding a way to present complex data without overwhelming your audience is no easy task. The Quadrant Circle Diagram helps you organize information into four easy-to-understand segments, making it ideal for visual learners. This clear layout ensures that your key points grab attention without causing confusion.
Data analysts, financial planners, and marketing strategists would find this slide invaluable in their presentations. For instance, you can use it to compare market trends, categorize demographic data, or illustrate different product categories during a business review meeting. Each quadrant effectively highlights critical elements for your audience.
Available for just $0.99, this slide is an instant download that you can easily edit in PowerPoint or Google Slides. With a few clicks,
you can customize it to fit your own content and have it ready for use in no time.
$0.99 – Purchase Checkout
Added to cart







