Present Segmented Information with Circular Diagrams
Product Description
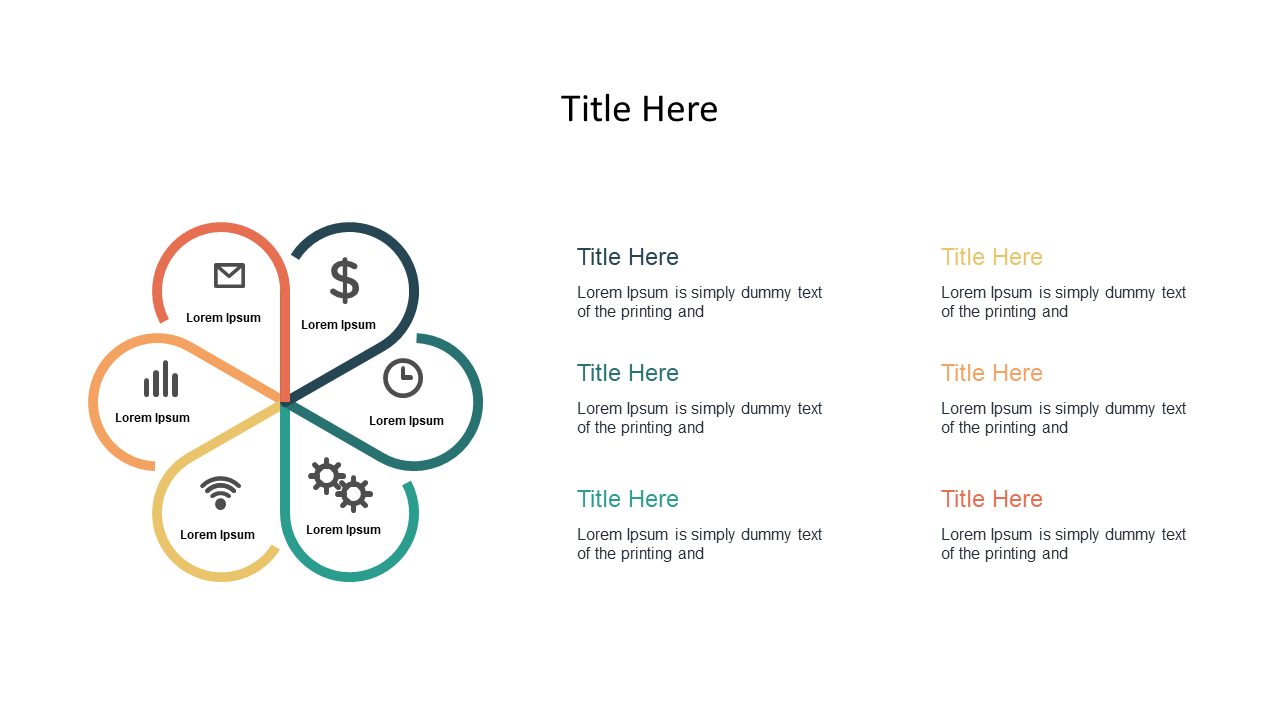
When you face the challenge of conveying segmented information, having a clear visual representation is essential. This circular diagram simplifies the process by allowing you to present complex data in a structured and engaging format with six distinct sections.
Business analysts discussing market trends, operations managers outlining project phases, or team leaders explaining strategic initiatives will benefit greatly from this slide. Each section can be easily customized with icons and text, making it perfect for meetings where detail matters.
At just $0.99, this slide is ready for instant download and can be easily edited in PowerPoint or Google Slides. You’ll have a polished visual in a matter of minutes to impress your audience.
$0.99 – Purchase Checkout
Added to cart







