Illustrate Processes with Colorful Gears
Product Description
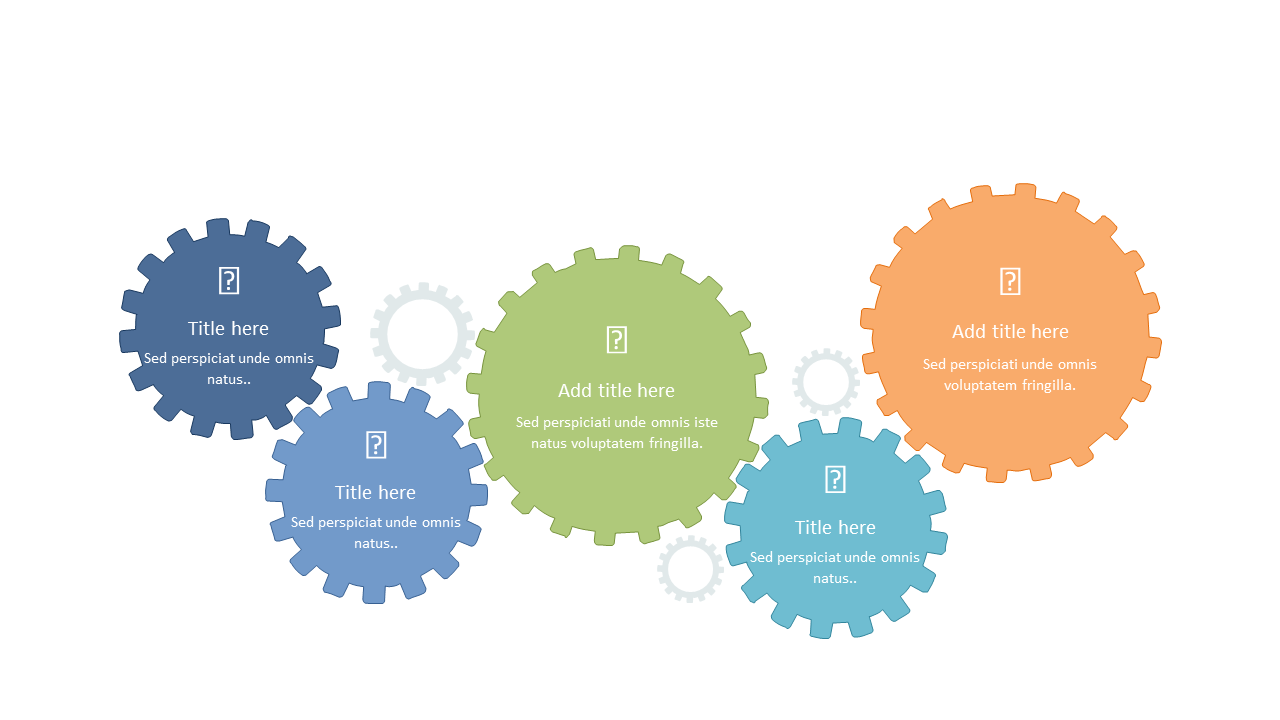
Making complex processes clear can be daunting, especially when you need to keep your audience engaged. This colorful gears slide simplifies the task by visually representing how different components interlink, making it easy for your audience to grasp the sequence and relationships involved.
This slide is perfect for project managers, operations specialists, or product developers who need to illustrate workflows during team meetings, client presentations, or training sessions. Use it to clarify project phases or to communicate operational strategies effectively.
Costing only $0.99, this slide is an easy download and can be edited right in PowerPoint or Google Slides. You’ll have a customized presentation ready in minutes, making it a valuable addition to your toolkit.
$0.99 – Purchase Checkout
Added to cart







