Illustrate Workflows with Numbered Steps Layout
Product Description
When it comes to showcasing complex workflows, a lack of clarity can create significant obstacles. Without an effective visual, your audience may struggle to understand even the best-laid plans.
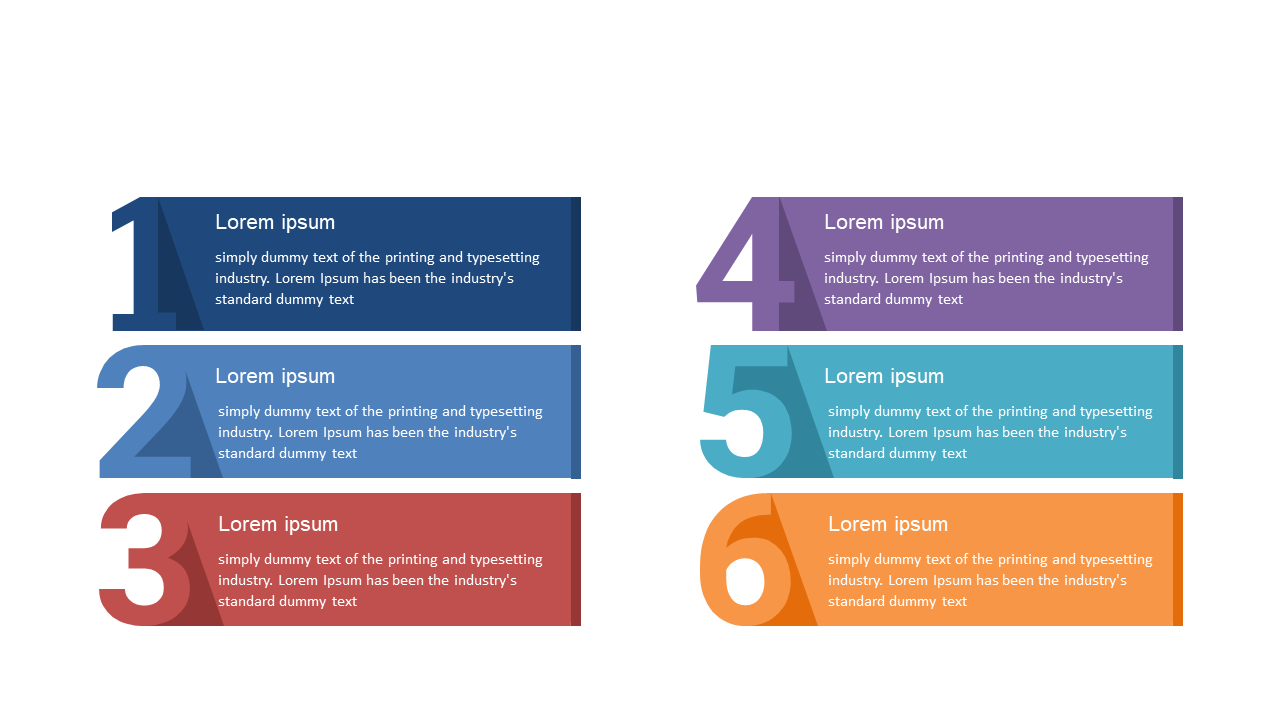
This slide offers a straightforward layout that combines numbered steps with descriptive text blocks, making it easy to present processes in a simplified manner. Ideal for business analysts presenting data-driven processes or team leads discussing new project milestones, this slide fits perfectly into meetings where detailed workflow discussions take place. It helps ensure everyone is aligned and understands the steps required to achieve success.
For only $0.99, you can instantly download this slide and customize it in PowerPoint or Google Slides. Take the guesswork out of your presentations and guide your audience with clarity.
$0.99 – Purchase Checkout
Added to cart