Present Sequential Ideas with Numbered Key Points
Product Description
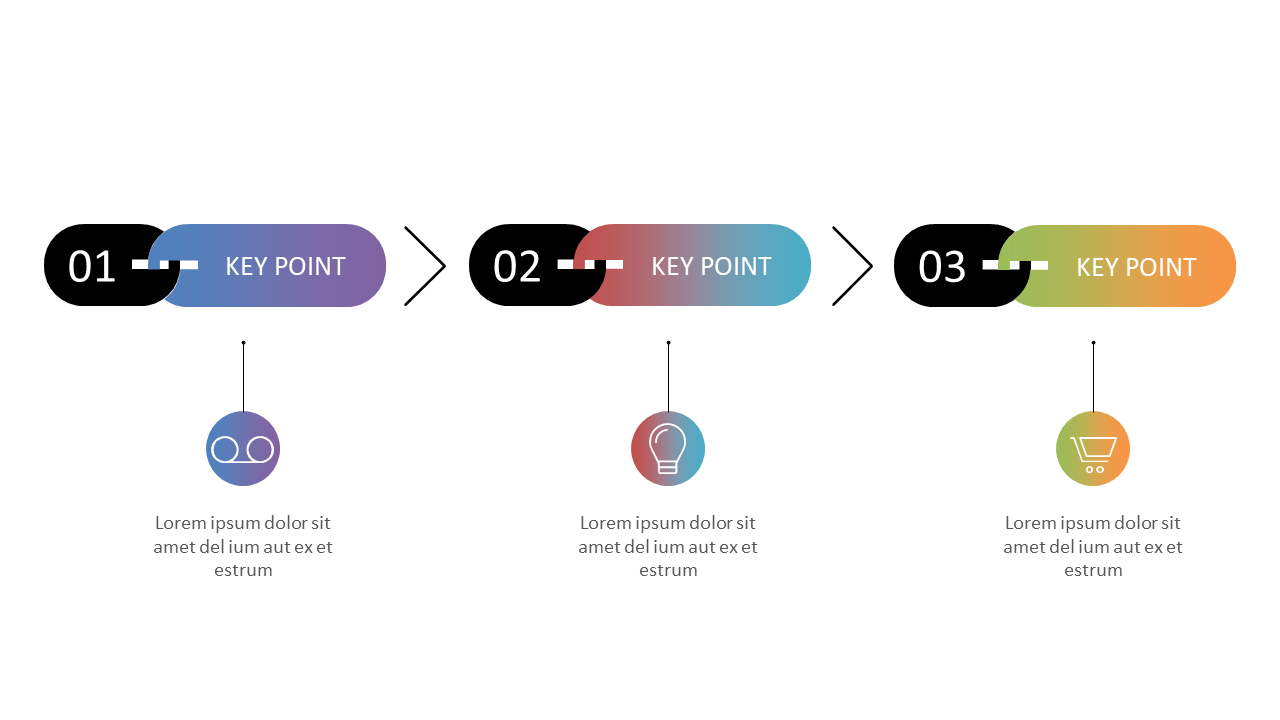
When you need to present sequential ideas clearly, clear visuals can make a significant impact. This slide presents numbered key points connected by arrows, creating a logical flow that’s easy for your audience to grasp.
Business analysts can employ this during presentations to report findings or present project timelines, while educators may find it useful for illustrating lesson plans. This slide makes your ideas stand out and ensures clarity for your audience.
Available for just $0.99, this slide is easy to download and edit in both PowerPoint and Google Slides. Customize it quickly and get your message across effectively in minutes.
$0.99 – Purchase Checkout
Added to cart
✅ Instant delivery
✅ Fully editable
✅ PowerPoint & Google Slides
Category:
$0.99
Per slide · No minimum · Pay only for what you pick
✓ $0.99/slide
No minimum order
✓ Mix any category
No subscription
Building a full deck?
Mix slides from any of our 58 categories —
all merged into one PowerPoint.
$0.99/slide, no minimum.
Browse All Slides →