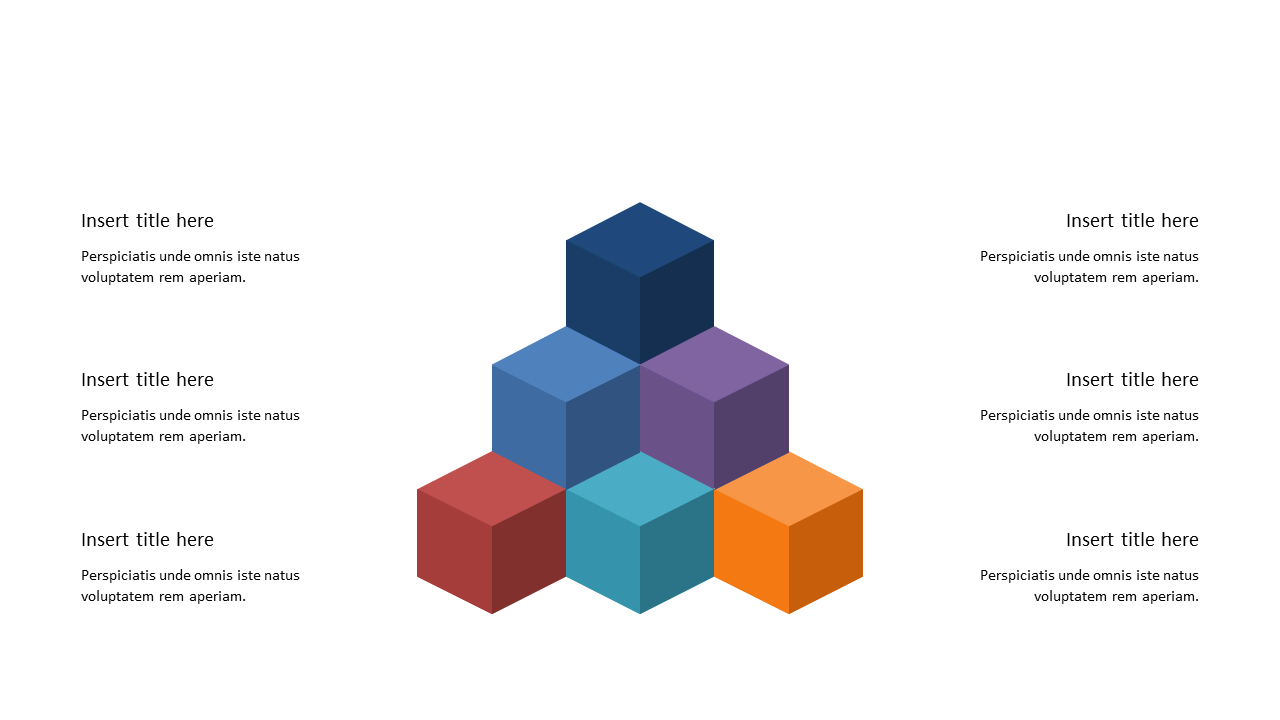
Show Hierarchy with 3D Stacked Cube Pyramid
Product Description
Navigating complex hierarchical information can be a daunting task, especially when clarity is crucial for understanding your message. This visually appealing 3D stacked cube pyramid helps you present layers of data in an engaging way, ensuring your audience grasps the relationships within the information without confusion.
This slide is ideal for project managers detailing team structures during strategy meetings, marketing professionals illustrating brand hierarchies, or educators explaining organizational frameworks in academic settings. By clearly laying out different levels of data, you can foster better comprehension and discussion among your audience.
At just $0.99, this slide is an instant download and fully editable in both PowerPoint and Google Slides.
You can customize it to fit your needs quickly, giving you more time to focus on delivering your message effectively.
$0.99 – Purchase Checkout
Added to cart