3D Pyramid Diagram for Hierarchical Presentations
Product Description
Presenting complex data can often lead to confusion if the audience can’t easily understand the relationships at play. A clear visual representation helps make those hierarchies digestible, ensuring that your key points stand out.
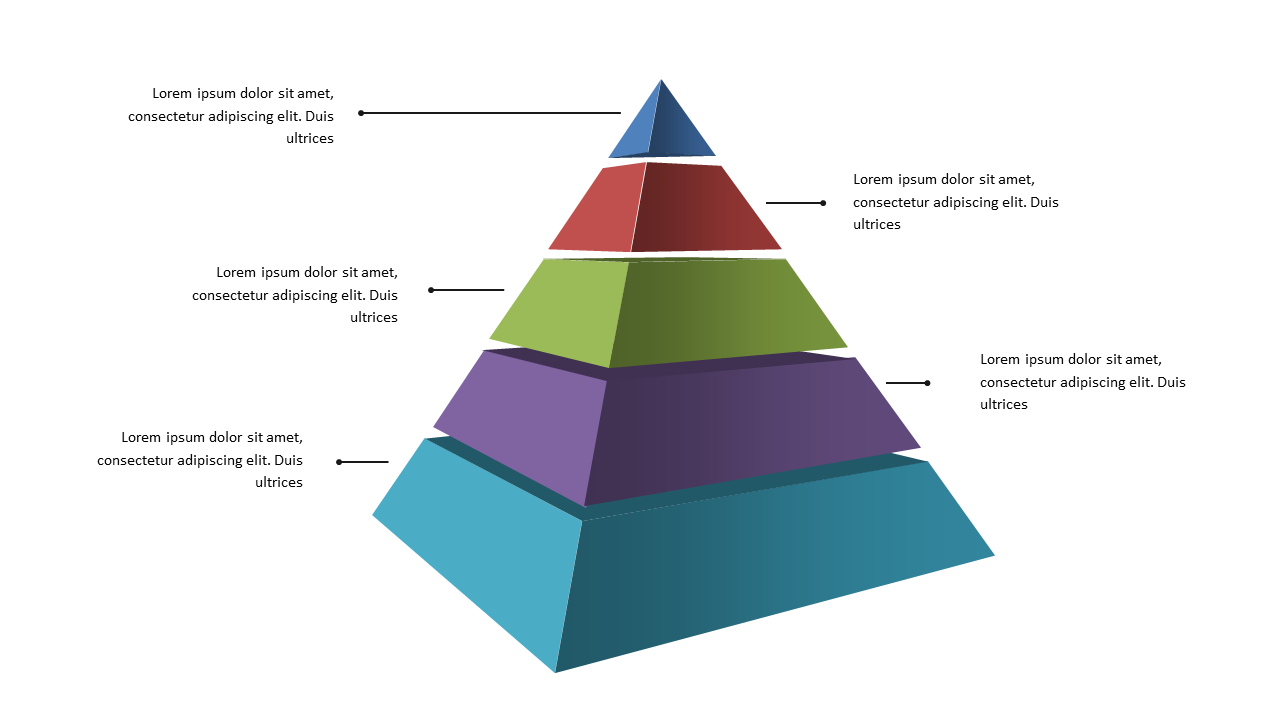
This 3D pyramid diagram is crafted to turn complicated data into something your audience can visualize and comprehend with ease. This slide is perfect for project managers sharing organizational structures, marketing teams discussing target audiences, or consultants presenting business models. Whether you’re in a boardroom meeting or leading a training session, this diagram can enhance your presentation by clarifying important hierarchies.
For just $0.99, you can download this slide instantly and start customizing it to your needs. It’s fully editable in PowerPoint or Google Slides, making it quick and easy to tailor the diagram to fit your specific message.
$0.99 – Purchase Checkout
Added to cart







