Analyze Products with a 4-Quadrant Framework
Product Description
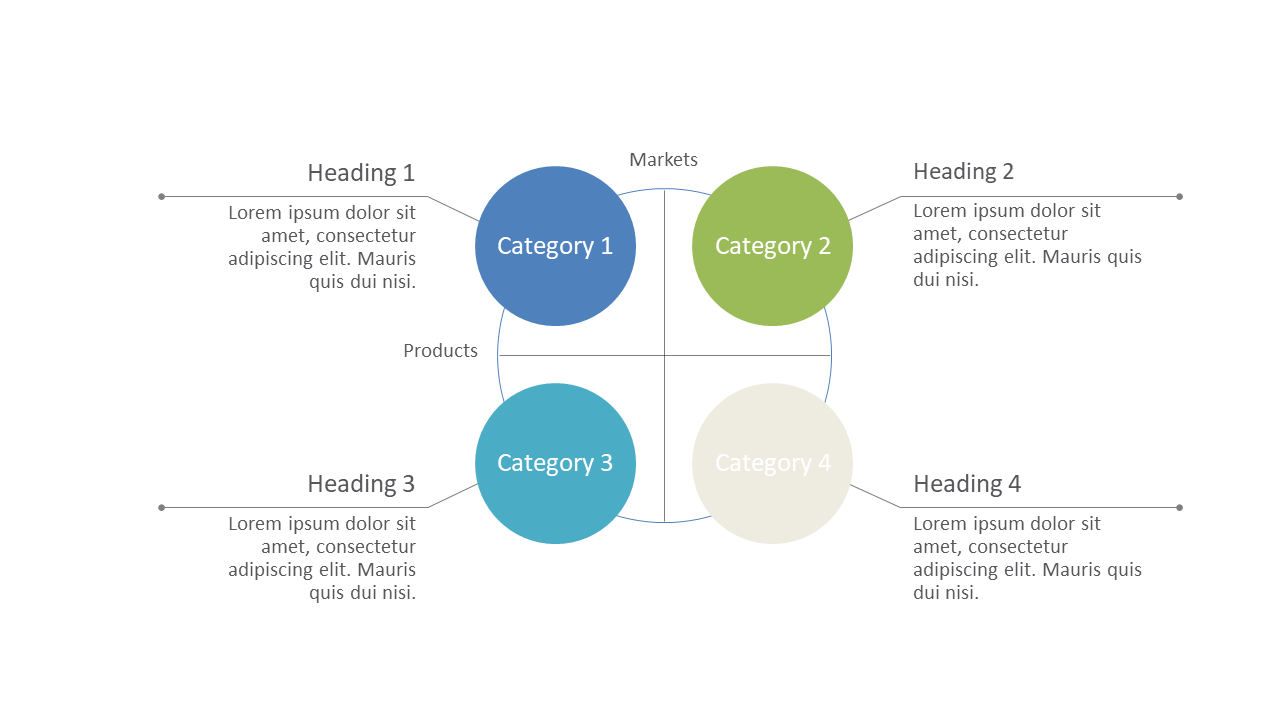
Understanding product performance can often feel overwhelming, especially when you need to analyze how different categories stack up in the market. This slide provides a clear 4-quadrant framework that helps you visualize product dynamics effectively, making complexities easier to manage.
Product managers conducting competitive analyses, market researchers segmenting consumer data, or business analysts looking to evaluate product positioning will find this slide particularly useful. It offers a straightforward way to illustrate market insights and support decision-making.
At just $0.99, you can download this slide instantly and edit it in both PowerPoint and Google Slides. It’s designed for quick customization, enabling you to create a professional presentation with ease.
$0.99 – Purchase Checkout
Added to cart







