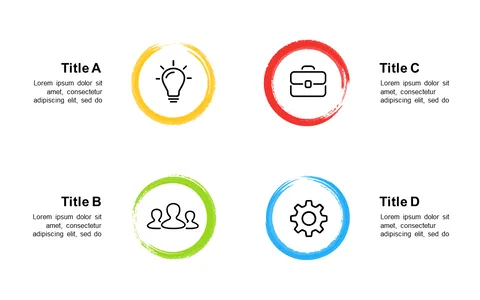
Four Quadrant Icons for Visual Concept Presentation

Product Description
When trying to convey complex ideas, keeping your audience focused can be a real struggle. This slide lets you break down those multifaceted concepts into four distinct quadrants, complete with icons and descriptive text for clarity.
It’s a visual aid that helps maintain engagement and understanding during presentations. You’ll find this slide particularly useful if you’re a business analyst presenting data insights, a project coordinator sharing updates, or a creative director brainstorming design concepts. It’s effective in various situations, from team meetings to client presentations where clarity is key.
For just $0.99, this slide is available for instant download and is easily editable in PowerPoint and Google Slides. You can have it tailored to your needs in just a few minutes, ensuring you’re ready to impress your audience.
$0.99 – Purchase Checkout
Added to cart