Four Quadrant Icons for Concept Showcase

Product Description
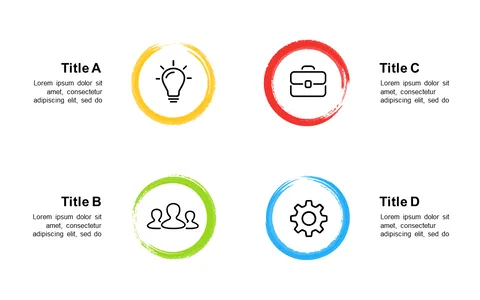
Presenting complex ideas can be a challenge, especially when you want to keep your audience engaged. This slide, featuring four quadrants with unique icons and descriptive text, simplifies the process by visually breaking down your concepts.
It’s designed to make intricate information easy to understand at a glance. You’re likely to find this layout valuable whether you’re a product manager outlining features, a consultant sharing strategic recommendations, or a teacher presenting a multi-layered topic. It’s an effective way to illustrate ideas during client meetings, workshops, or educational seminars.
For just $0.99, you can download this slide instantly and customize it in PowerPoint or Google Slides. With just a few clicks, you can add your content and be presentation-ready in minutes.
$0.99 – Purchase Checkout
Added to cart