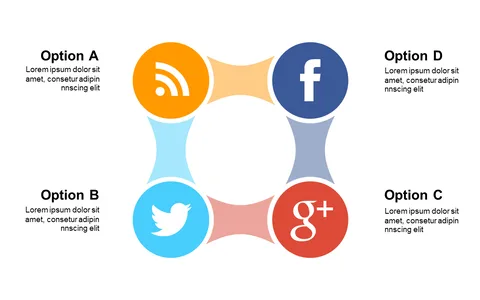
Showcase Phases with Circular Puzzle Design

Product Description
Struggling to convey interconnected phases in your projects can lead to confusion among your audience. You need a visual representation that portrays clarity while showing the relationships between various stages. This circular puzzle design offers a creative solution, allowing you to showcase different phases in an organized manner.
Project managers explaining timelines can use this slide to depict project stages, while marketing teams can visualize their campaign phases during progress reports. It’s also suitable for educators who want to illustrate the connections within a curriculum or research project.
The editable text areas make it easy to fit your specific content. For just $0.99, you can download this slide instantly and start personalizing it. It works beautifully in both PowerPoint and Google Slides, making it a breeze to integrate into your presentation within minutes.
$0.99 – Purchase Checkout
Added to cart