Present Smart City Strategies with Quadrant Analysis

Product Description
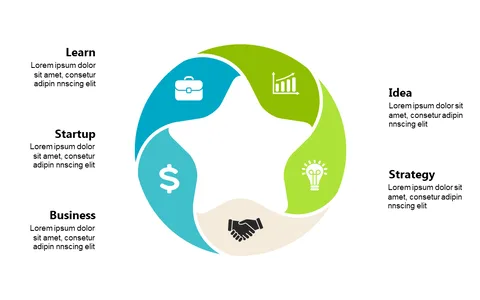
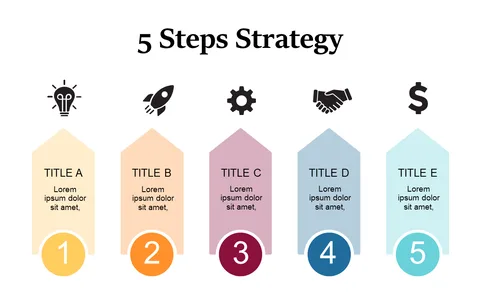
Navigating urban development strategies can be complex, especially when trying to present multifaceted initiatives clearly. This slide employs quadrant analysis to help you illustrate key components of your smart city strategy in an organized and visually appealing way.
It makes complicated information easier to understand at a glance. This slide is particularly suited for urban planners, city officials, or strategy consultants during team meetings, public forums, or stakeholder presentations. It enables you to break down your approaches into clear, actionable components for better audience comprehension.
Available for just $0.99, you can download this slide right away and edit it in both PowerPoint and Google Slides. It’s designed for quick customization, ensuring you can present your ideas effectively without delay.
$0.99 – Purchase Checkout
Added to cart