Compare State Demographics for Market Insights
Product Description
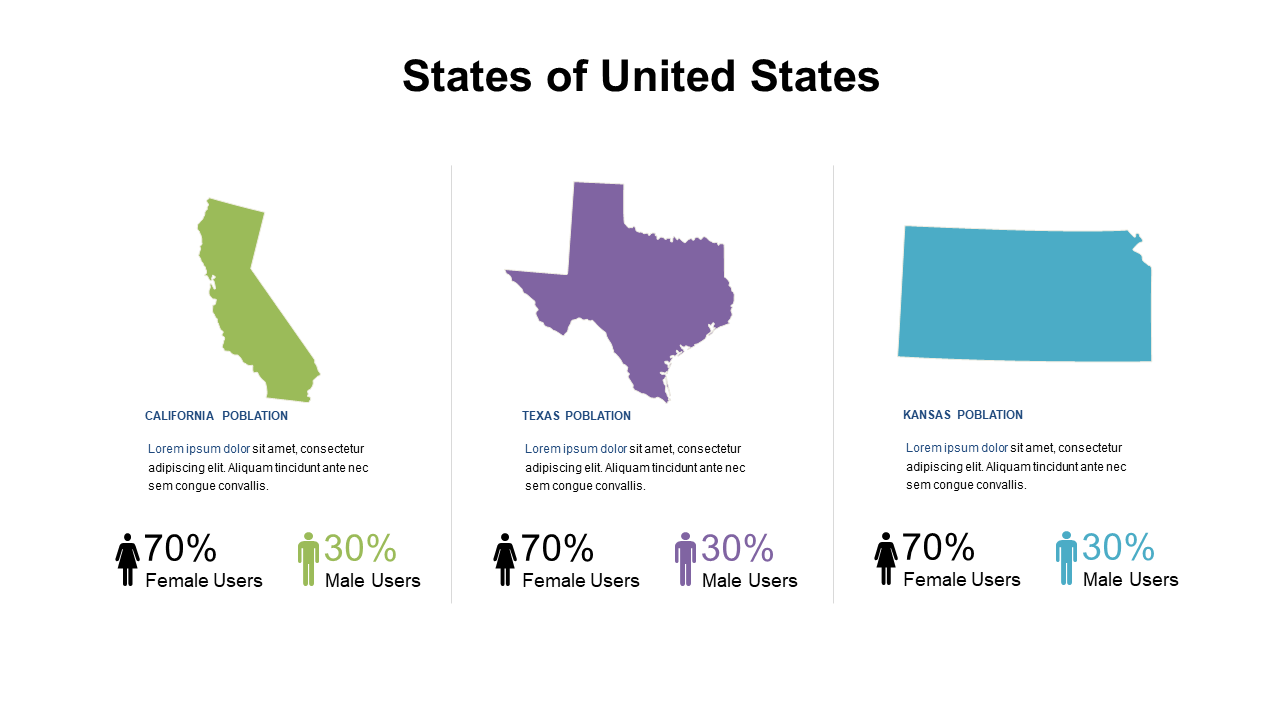
When you’re trying to sift through various state demographics, it’s easy to get bogged down in the details. This slide simplifies the process by providing a clean comparison of demographic statistics across different states, helping you focus on the most relevant insights for your audience.
This slide suits market researchers, business analysts, and product managers who are working on market assessments or competitive analyses. Whether you’re preparing for a major presentation or drafting a report, this visual comparison will help you articulate your points clearly.
Available for only $0.99, this slide can be downloaded instantly and is fully editable in PowerPoint and Google Slides. Transform your demographic data into powerful visual narratives without delay.
$0.99 – Purchase Checkout
Added to cart







