Present Key Messages for East Coast States

Product Description
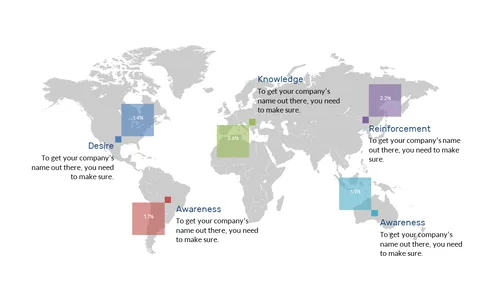
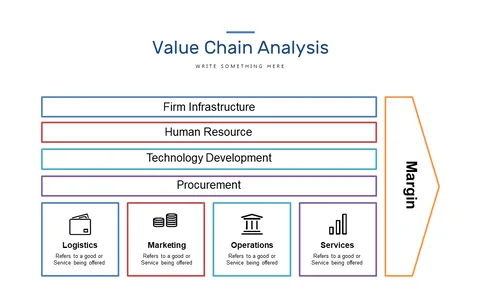
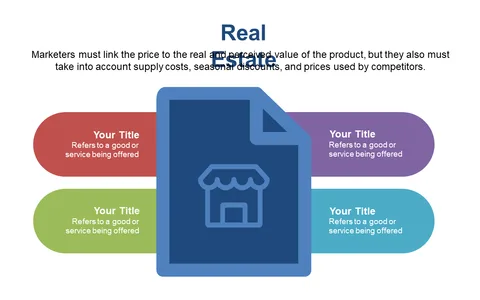
Presenting market research findings can be tricky, especially when trying to connect specific insights to geographical nuances. With this slide, you can easily convey tailored messages for each East Coast state, allowing your audience to grasp the unique market dynamics at a glance.
This slide is perfect for market analysts, sales strategists, or business development managers preparing for regional strategy meetings. Whether you’re pitching to leadership or presenting findings to a sales team, this slide’s clear visuals will help you communicate effectively.
For just $0.99, you can download this slide instantly and start editing it right away in PowerPoint or Google Slides. Make your market research presentations impactful and engaging in just a few minutes.
$0.99 – Purchase Checkout
Added to cart