Analyze East Coast States with Key Insights
Product Description
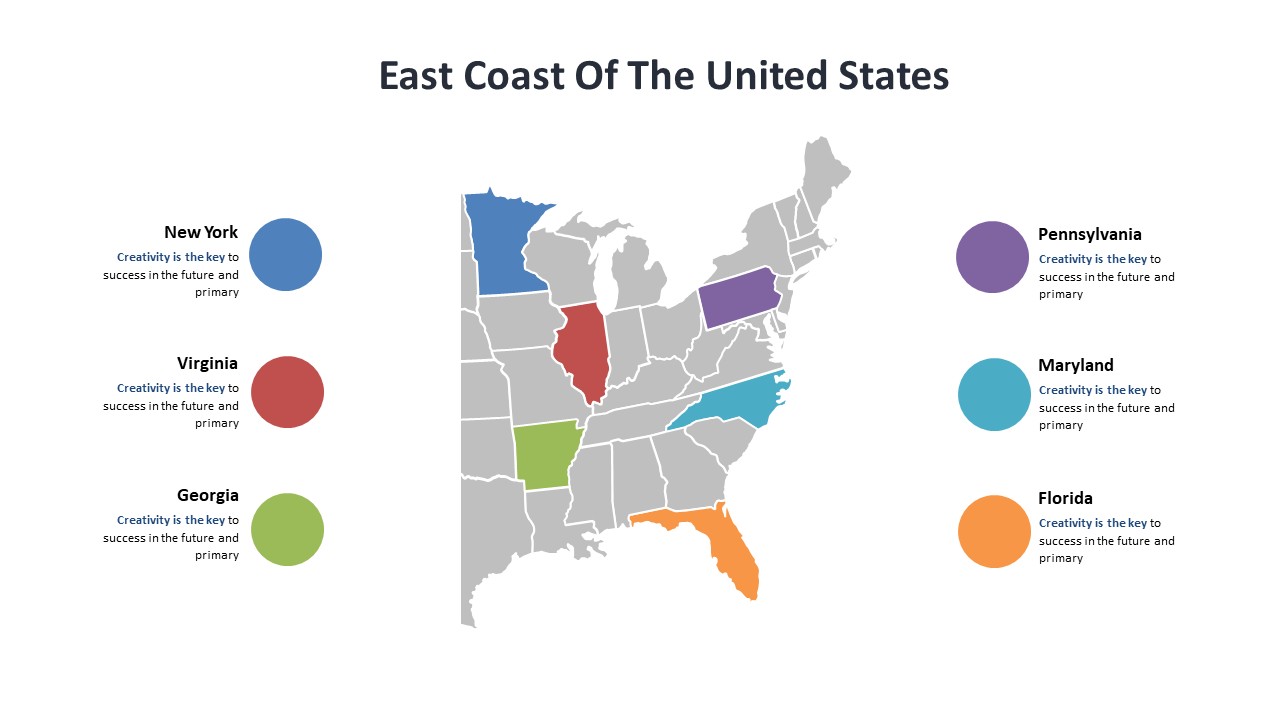
When you’re conducting market analysis, presenting dense data can easily overwhelm your audience. A clear, colorful map makes the information more digestible, allowing your viewers to quickly understand key insights about the East Coast states. This slide transforms complex analysis into a visually engaging format that fosters better comprehension.
Market researchers, business analysts, and sales strategists can make great use of this slide during presentations, client meetings, or team brainstorms. Whether you’re discussing market trends, regional sales performance, or competitive landscapes, this map will help you convey your findings effectively.
It’s an essential tool for anyone trying to make data more accessible. At just $0.99, this slide is ready for instant download and can be easily edited in both PowerPoint and Google Slides. Customize it to highlight the insights that matter most to you, and get it ready for your presentation in just a few minutes.
$0.99 – Purchase Checkout
Added to cart







