Outline Processes Clearly with Colored Steps
Product Description
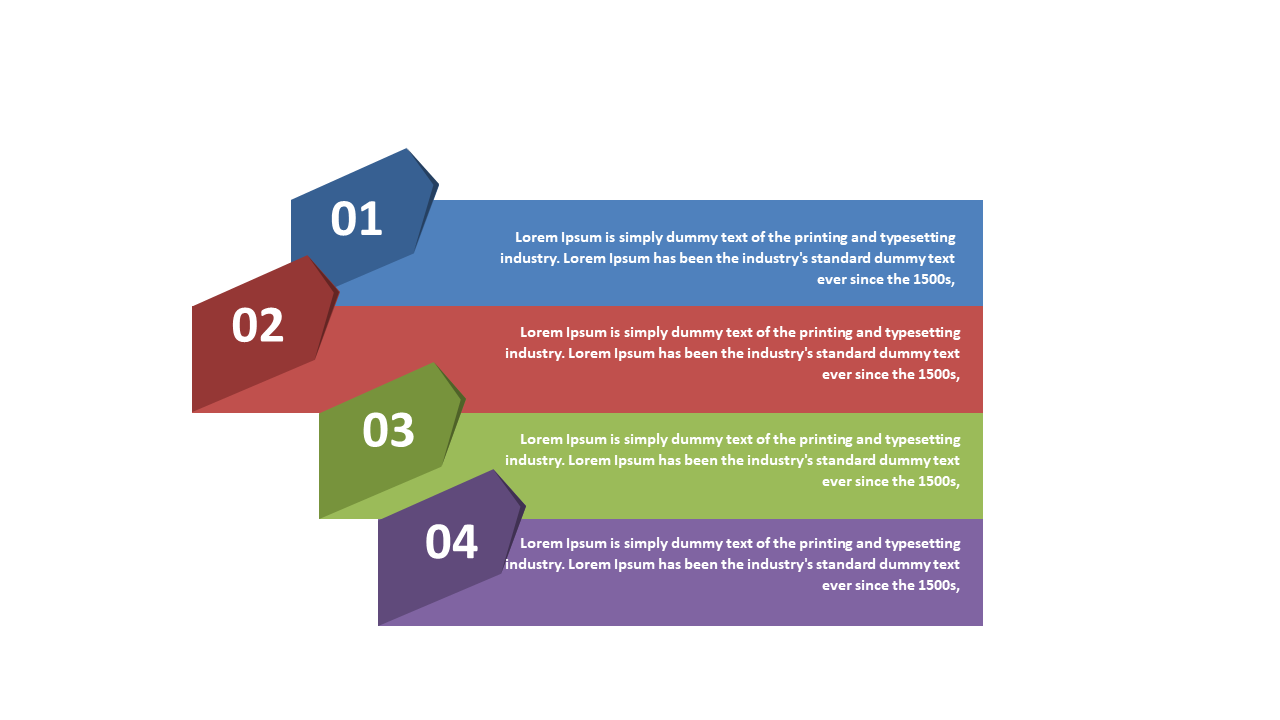
When you’re trying to explain a complex process, it’s all too easy for your audience to get lost in the details. This slide uses colored steps with numbered labels to clearly outline each phase, ensuring your message remains crystal clear.
The vibrant colors guide viewers through the process, making it easier to follow along. This slide is ideal for project managers presenting project phases, marketing professionals outlining campaign strategies, or educators explaining curriculum frameworks. You’ll find it especially useful during team meetings, client presentations, or training sessions where clarity is paramount.
For just $0.99, you can instantly download this slide and start editing it to fit your needs in PowerPoint or Google Slides. It takes mere minutes to customize it, allowing you to focus on delivering your message effectively.
$0.99 – Purchase Checkout
Added to cart







