Showcase Sequential Steps with Horizontal Chart V15
Product Description
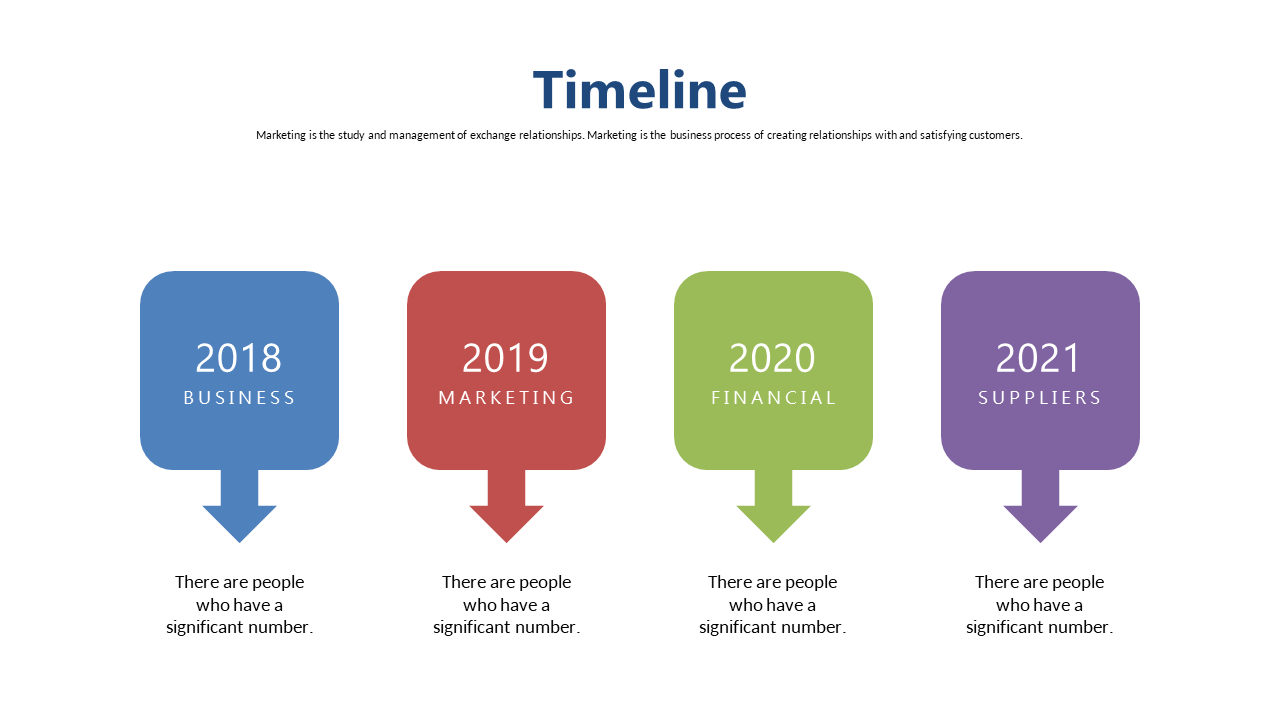
When presenting a complex process, it’s crucial that your audience understands each sequential step without getting lost in the details. This horizontal chart provides a visually engaging way to break down workflows, ensuring clarity and engagement throughout your presentation. It helps demystify processes so that everyone stays on the same page.
This slide is particularly useful for marketing managers developing campaign strategies or project coordinators reviewing task flows. It fits perfectly into meetings where clear communication of sequential steps is essential, such as project kickoffs or status updates with clients.
The color-coded arrows and icons guide your audience through each step effortlessly. At just $0.99, you can download this slide instantly and edit it in PowerPoint or Google Slides. You’ll have it ready in minutes, helping you create a polished and professional presentation.
$0.99 – Purchase Checkout
Added to cart







