Outline Workflows with Horizontal Chart V14
Product Description
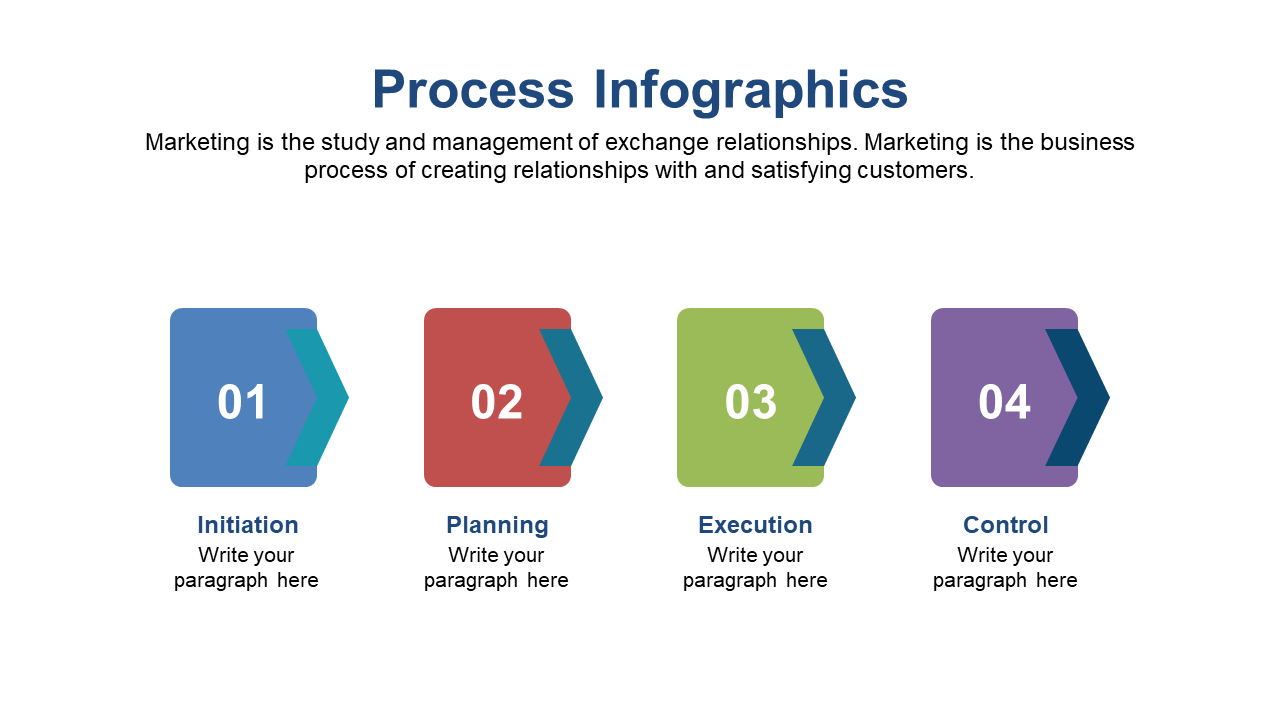
In a fast-paced work environment, conveying complex workflows can be overwhelming, especially if the details are intricate. This horizontal chart slide helps you outline your processes in a visually stimulating way that captures attention and makes your message clear. It ensures everyone in the room can follow along effortlessly.
This slide works perfectly for operations directors outlining procedures or product managers discussing development phases. Use it during team meetings or client presentations to clearly communicate steps in your workflow.
The vibrant colors and intuitive icons allow your audience to visualize each phase easily. For just $0.99, this slide is ready for instant download and can be edited in PowerPoint and Google Slides. You can have it up and running within minutes, allowing you to focus on what you do best — presenting.
$0.99 – Purchase Checkout
Added to cart







