Visualize Workflows with Horizontal Chart V12
Product Description
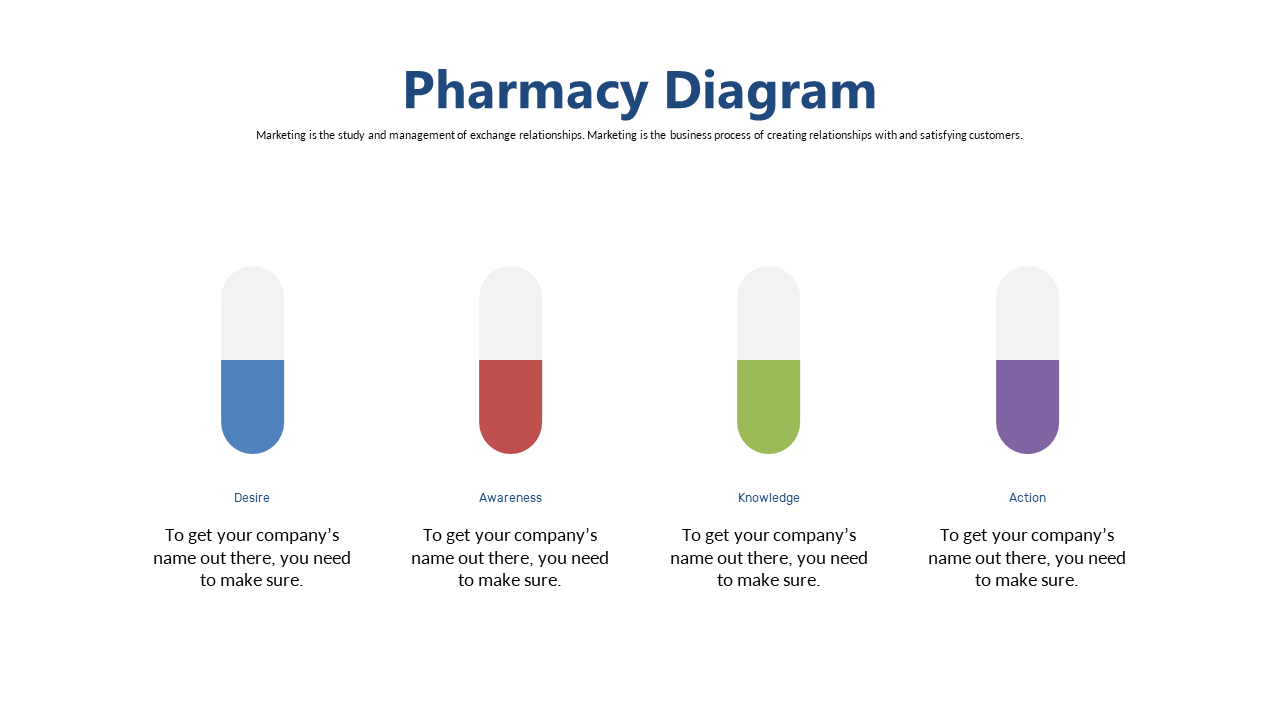
When you have multiple projects running and need to convey clear workflows, it can be challenging to maintain clarity in your presentations. This horizontal chart helps you present each step of your process in a visually engaging way, preventing confusion.
Your audience will appreciate the ease with which they can follow along, keeping them engaged throughout your presentation. Ideal for business analysts who need to walk through project timelines or operations managers detailing procedures, this slide shines in meetings where precise communication is essential. Use it to outline your workflow during quarterly reviews or internal briefings, ensuring everyone understands their role in the process.
Available for just $0.99, this slide is ready for instant download and can be conveniently edited in PowerPoint and Google Slides. You’ll have the perfect visual aid at your fingertips in a matter of minutes.
$0.99 – Purchase Checkout
Added to cart







