Engage Your Audience with Horizontal Chart V11
Product Description
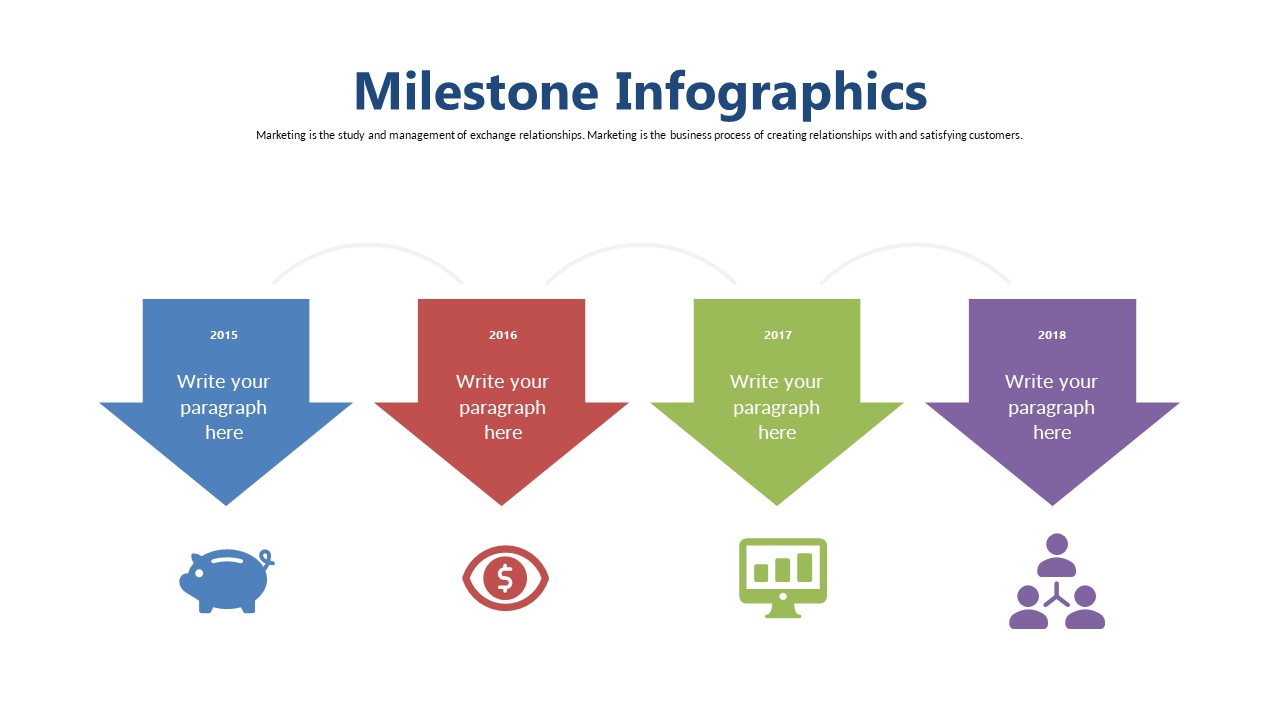
Keeping your audience engaged during process presentations can feel like an uphill battle, especially when the details become complex. Losing their interest while you try to explain intricate workflows is frustrating, but this horizontal chart is here to help. Its visually appealing format ensures that everyone stays focused as you guide them through each step.
Perfect for project managers outlining development processes or team leaders presenting operational workflows, this slide fits seamlessly into any meeting where clarity is crucial. Use it in your next review session or strategy meeting to effectively illustrate how tasks flow from one stage to the next.
The vibrant arrows and icons make it easy for anyone to follow along, regardless of their familiarity with the topic. At just $0.99, this slide is an instant download and can be easily edited in both PowerPoint and Google Slides. You’ll have everything ready in minutes, allowing you to focus on your message instead of worrying about visuals.
$0.99 – Purchase Checkout
Added to cart