Present Research and Analysis with Triangular Icons
Product Description
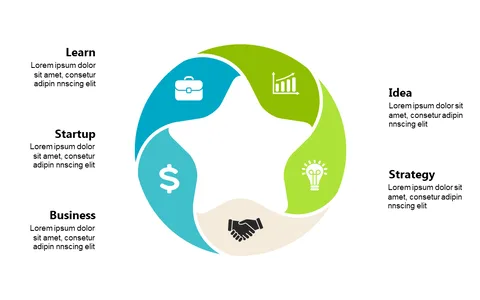
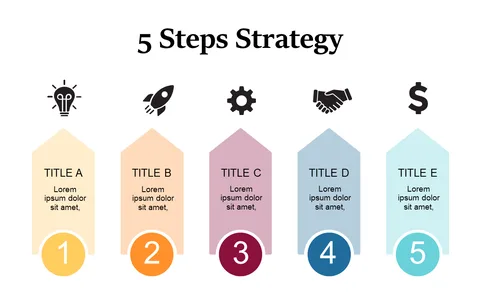
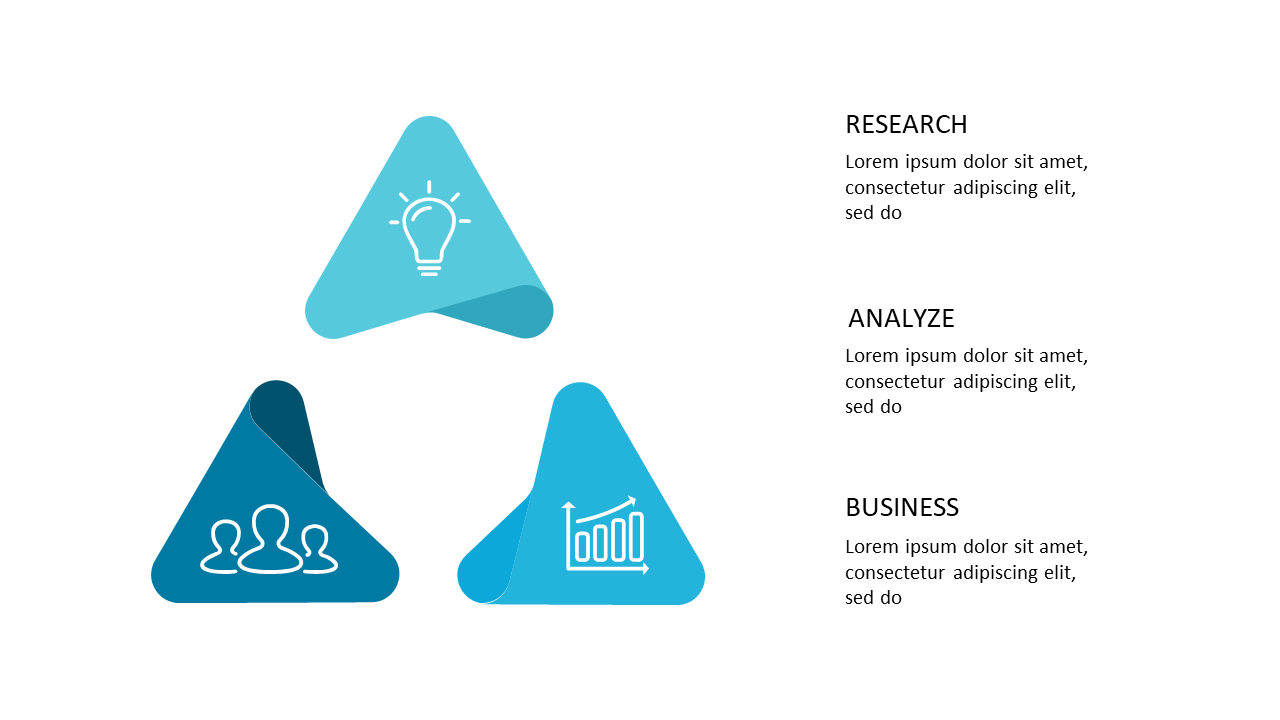
Communicating complex research findings can feel overwhelming, especially when trying to keep your audience engaged. This slide simplifies that process by using triangular icons to represent key concepts like Research, Analyze, and Business, making your analysis easily digestible.
Its visually appealing format also invites interest, ensuring your audience stays focused. Management consultants, analysts, or anyone involved in data presentation will find this slide invaluable during client meetings or strategy sessions. It helps convey intricate information quickly, enabling you to highlight the most important points without losing your audience’s attention.
For just $0.99, this slide is available for instant download. You can easily edit it in PowerPoint or Google Slides, ensuring a quick turnaround for your presentations.
$0.99 – Purchase Checkout
Added to cart