KPI Dashboard PowerPoint Template — 2 Best Picks for Your Next Report (2026)
You’ve been building KPI slides from scratch in PowerPoint for the third quarter in a row. Copy-pasting charts from Excel, fixing alignment that breaks every time you change a number, resizing text boxes at 11pm before a 9am review. These two templates fix that. Start at $3.99 for 8 slides or $5.99 for 20 — pick the one that matches your reporting cycle, edit the numbers, and you’re done.
Weekly standup or executive briefing → KPI Dashboard Vol. 1 ($3.99, 8 slides). Clean slate-blue layout, one metric per slide, builds in under an hour. Quarterly review covering multiple teams → KPI Performance Dashboard ($5.99, 20 slides). Enough room for every department without crowding any slide. Both work in PowerPoint, Google Slides, and browser.
KPI Dashboard Vol. 1 — Best for Executive Briefings and Weekly Standups
Your leadership meeting is in 90 minutes. You need to show revenue trend, pipeline health, and team utilization — on slides that don’t look like a spreadsheet printout. Eight slides. Slate blue. One metric per slide, laid out so a CFO can read it across a conference table without leaning forward. No clutter, no 12-chart overload. Just the numbers that matter, formatted and ready.
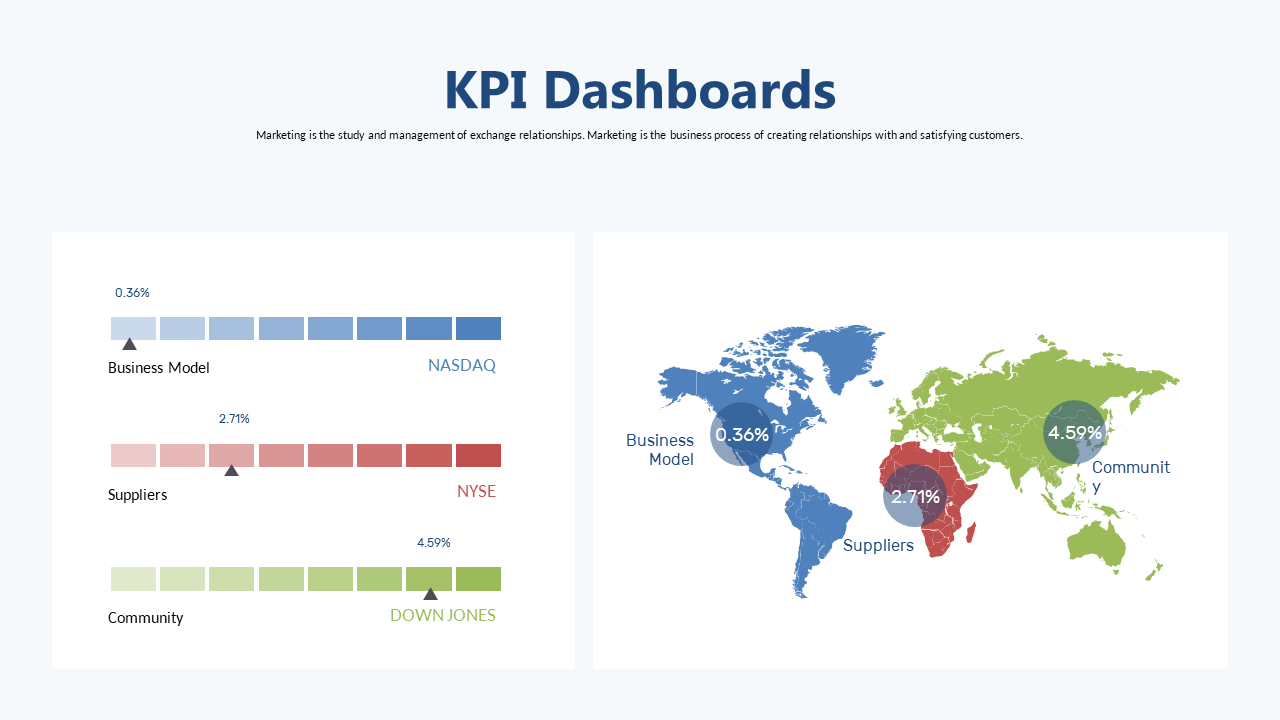

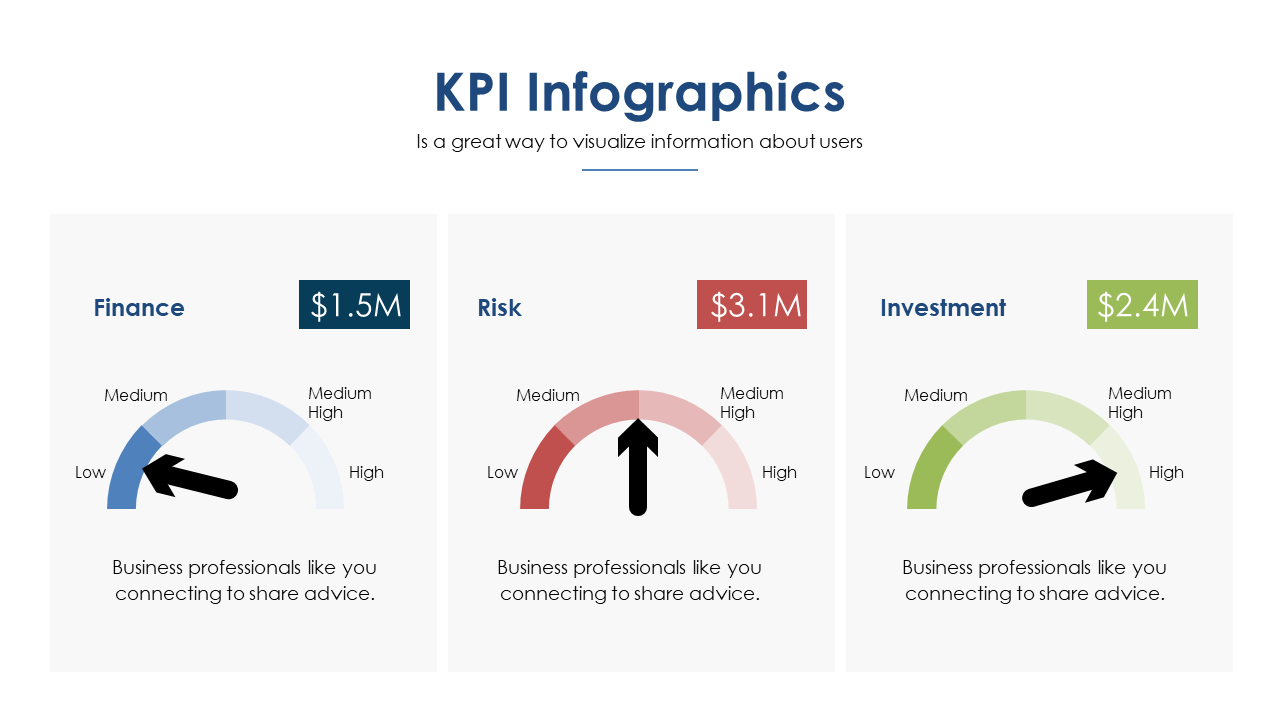
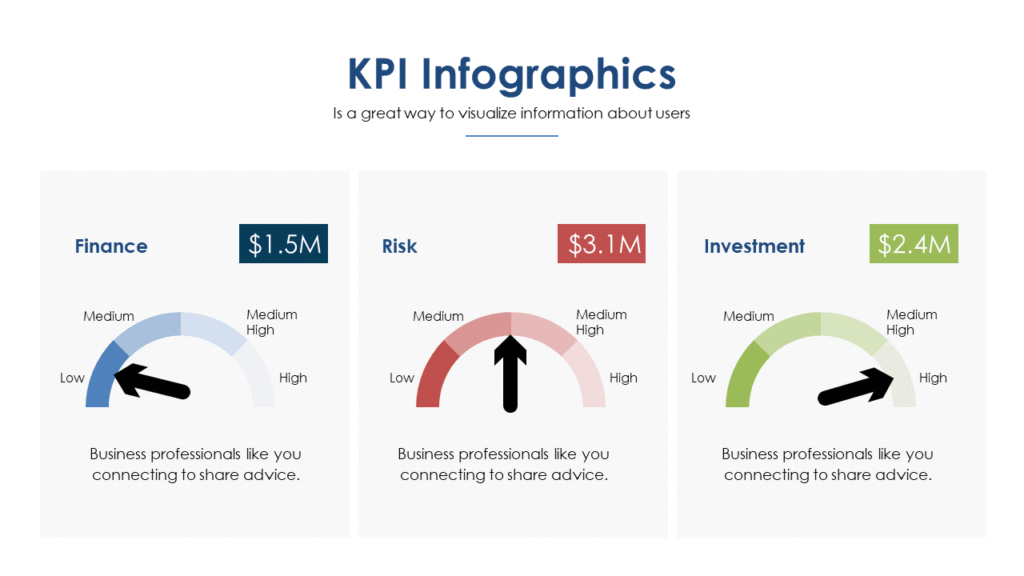
The slate blue color scheme works because it’s boardroom-neutral without being bland. Each of the 8 slides is built around a single primary metric with supporting context — a bar comparison, a circular progress ring, or a clean number call-out. The formatting is already done. Your job is replacing the placeholder numbers, not redesigning the layout.
- 8 slides sized for one metric per slide — no crowding, no information overload
- Slate Blue accent on a light background — projects clearly in bright conference rooms
- Includes trend charts, target-vs-actual comparisons, and key number highlights
- Fully editable in PowerPoint, Google Slides, and browser
📊 Light: 8 slides
🎨 Light theme
📁 PowerPoint + Google Slides + Browser
What Makes a KPI Dashboard Deck Actually Work?
Most KPI presentations fail for one of three reasons — and none of them are about the data.
They show too much. Fourteen metrics on one slide because you want to look thorough. Revenue, churn, NPS, CAC, LTV, team utilization, project completion, and six more — all on slide 3. Your audience reads none of it. A KPI slide should answer exactly one question: are we on track? One metric. One answer. One slide. If you have 12 things to show, you need 12 slides — or a better prioritization conversation before the meeting.
The design fights the data. Gradient backgrounds behind white text behind colored charts behind drop shadows. The data gets buried under the decoration. A clean, light-background slide with one accent color forces the numbers to do the work — which is what they’re there for. When you see a KPI deck that looks effortless, that simplicity was a deliberate design decision, not a lack of effort.
There’s no structure. Slides jump from sales to ops to HR with no flow. The audience spends half the meeting figuring out where they are instead of responding to what they’re seeing. A well-structured KPI deck follows a pattern: overall health → department breakdown → exceptions and flags → next actions. When people can anticipate the shape of the deck, they focus on the content instead of the navigation.
Both templates here are built on that structure. You’re not fixing the architecture — you’re filling in your numbers. For a review covering multiple departments, the 20-slide version gives you room to dedicate 4–5 slides per team without squeezing anything.
KPI Performance Dashboard — Best for Quarterly Reviews and Multi-Department Reports
Quarterly business review. Sales, ops, finance, and customer success — four departments, one deck, one room, 45 minutes. The KPI Performance Dashboard gives you 20 slides to cover all of it. That’s 4–5 slides per team, a summary page up front, and still room for an exceptions slide at the end. No cramming, no deciding which department gets cut from the presentation.
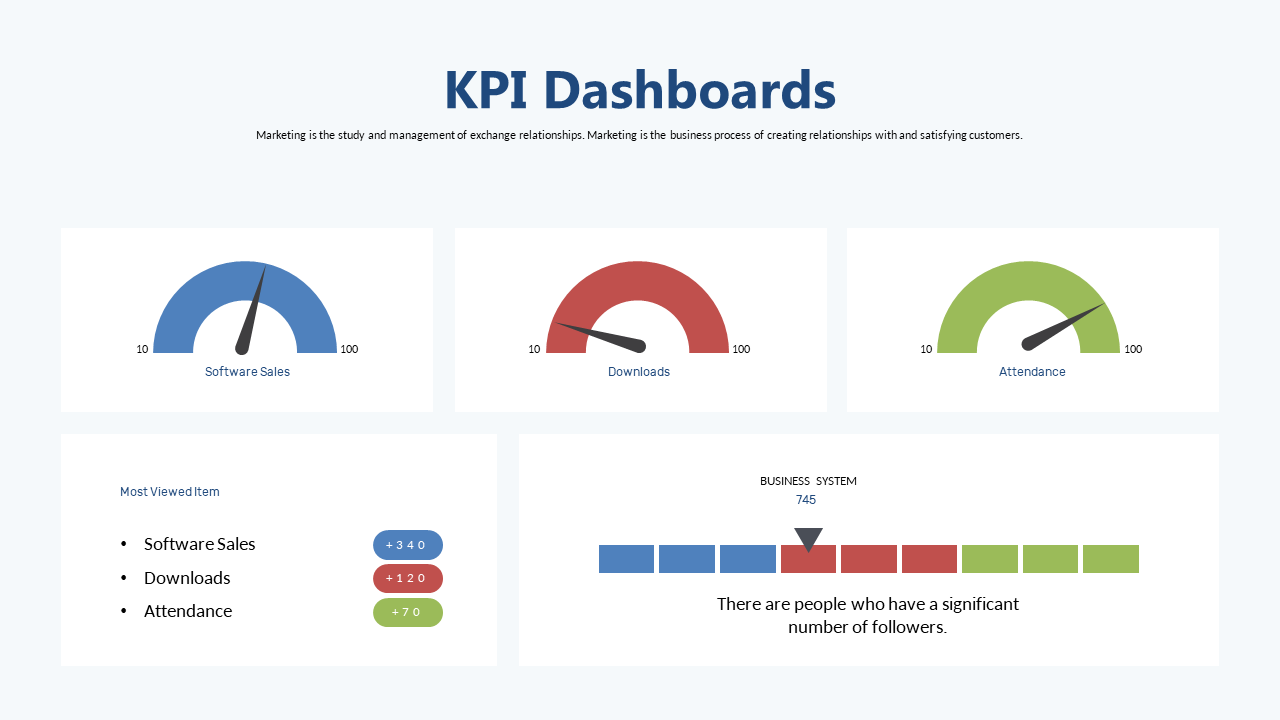
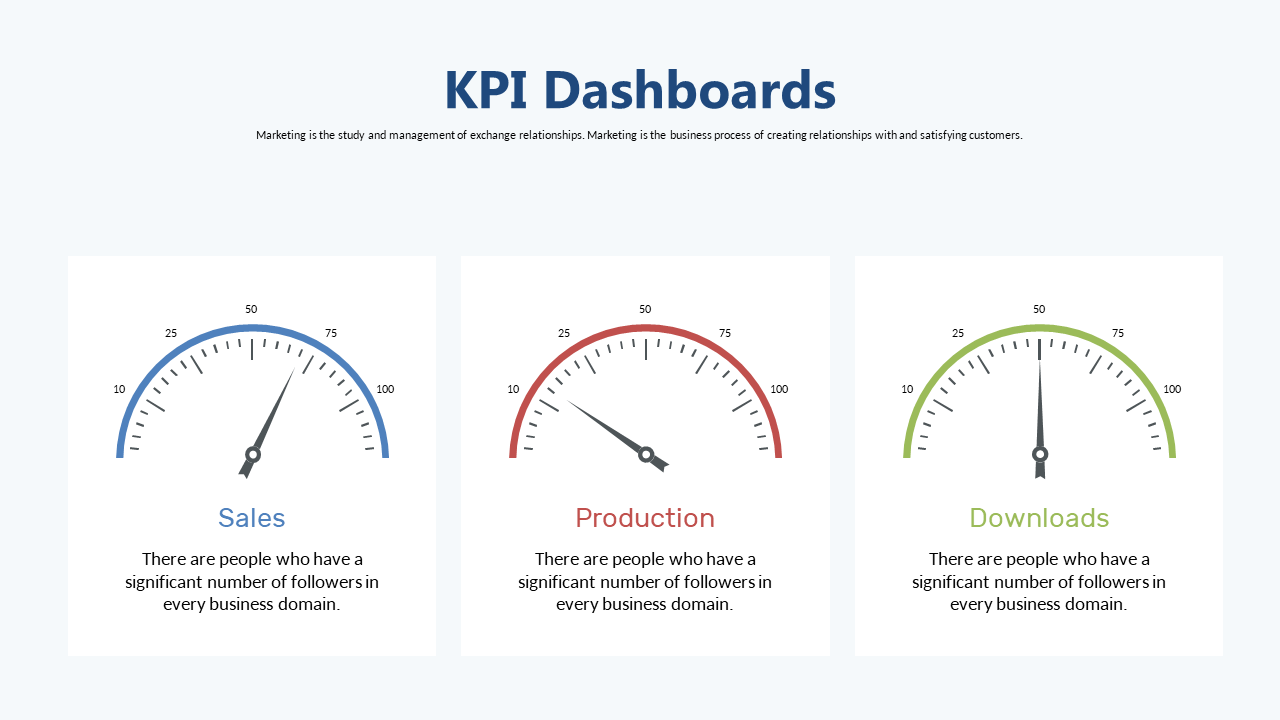
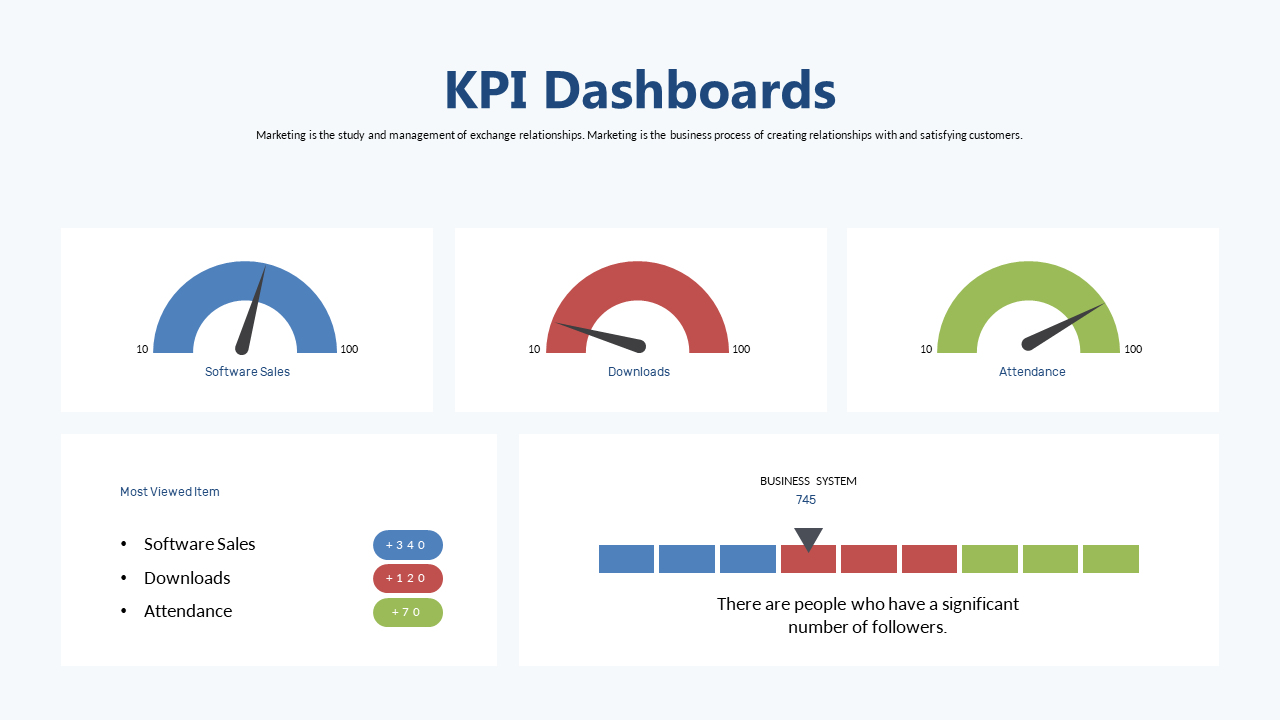
Twenty slides sounds like a lot. It isn’t, for what this template is built to do. Each slide stays light — one to three data points, white background, clearly labeled. You won’t be filling every slide. The smarter use of this template is to open it, delete the 8 slides you don’t need, and work with the 12 that match your actual reporting structure. That’s a faster starting point than building from a blank file.
- 20 slides — enough for full quarterly or annual reporting without crowding
- Light theme, white background — your data stands out in any room or screen
- Includes bar charts, circular dashboards, summary tiles, and trend comparisons
- Built for multi-stakeholder presentations — structured for clarity, not volume
📊 Light: 20 slides
🎨 Light theme
📁 PowerPoint + Google Slides + Browser
How to Actually Use a KPI Dashboard Template
The fastest way to customize either of these templates isn’t to start from slide 1 and work forward. Here’s the process that takes less time than formatting a single Excel chart from scratch.
Delete first, edit second. Open the template and go through every slide. Identify the ones that match your actual metrics. Delete everything else. If you’re using the 20-slide version for a team of three, you probably need 8–10 slides max. Delete the rest before touching a single number. A tight deck is faster to finish than a bloated one.
Replace data, not design. Don’t move anything. Don’t change the fonts or layout. Just click into the charts — right-click, Edit Data in PowerPoint, or click the linked table in Google Slides — and swap the placeholder numbers for your actual figures. The design handles everything else automatically. Most slides take 2–4 minutes each.
Logo and accent color last. Once the data is in, drop your company logo on the title slide and adjust the accent color if needed. In PowerPoint: Design → Customize Colors. In Google Slides: Slide → Change Theme. One change updates the accent across every slide. Total time: under 5 minutes.
Need Just One KPI Slide Instead?
Not every report needs a full deck. Sometimes you just need one clean dashboard slide to drop into a presentation that already has its own template — a weekly standup, a board pre-read, or an investor update. Individual KPI slides are available in the Slide Library starting at $0.99 each. Buy one, drop it in, done.
Common Questions
Can I edit the charts with my actual numbers?
Yes. Both templates use standard chart elements in PowerPoint — bar charts, circular dials, and number tiles. Click into any chart, open the data editor, and replace the placeholder values with your own. In Google Slides the same process applies. No plugins, no external tools. The chart updates automatically when you change the underlying figures.
How many KPI slides do you actually need in a deck?
Most effective KPI presentations use 6–10 slides. One summary, 4–6 metric slides at one key metric each, one exceptions slide, and one next-actions slide. More than 12 slides and your audience stops tracking. Fewer than 5 and you’re missing context. The 8-slide Vol. 1 template is already the right size for most weekly and monthly reporting formats — use the 20-slide version only when you’re covering multiple departments.
Light theme or dark for KPI slides?
Light, for most contexts. Dark themes look sharp on a monitor or in a dim room, but they lose contrast when projected under standard overhead lighting in a conference room. Both templates here use light themes, which is the right call for boardroom, investor, and all-hands reporting. If you’re running a product demo or design review — that’s when dark works.
Which Template Should You Pick?
Weekly standup, leadership update, or briefing where you need to move fast → KPI Dashboard Vol. 1 at $3.99. Eight focused slides, done in under an hour.
Quarterly review, annual report, or any presentation covering more than two teams → KPI Performance Dashboard at $5.99. Twenty slides with room to cover every function without squeezing anything.
Already have a deck and just need one clean KPI slide → browse the KPI Slide Library starting at $0.99.
Ready to get started?