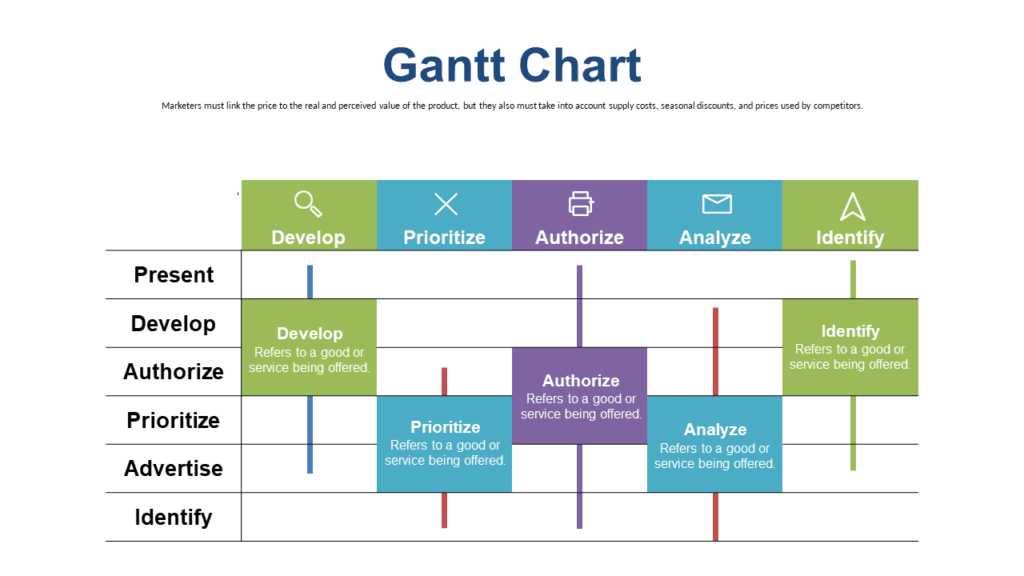
Your project review is two days out and someone’s going to ask why the timeline isn’t on the slides. This page covers a free Gantt chart template for PowerPoint, a $0.99 Gantt bar chart slide, and a $3.99 twenty-slide Gantt deck — all editable in PowerPoint and Google Slides. The free one is a flow chart (best for phase-based projects); the $0.99 option is the classic task/timeline bar format your stakeholders expect.
Free → Flow chart steps slide, light theme. Right pick when you need to show project phases sequentially — Discovery → Build → Launch — and don’t need date bars.
$0.99 → Dark-theme Gantt chart slide. The classic task/timeline bar format. Use it when your audience expects to see what’s running in parallel and what depends on what.
$3.99 → 20-slide Gantt deck in Slate Blue. Right pick if you’re building the full project presentation, not just inserting one chart slide.
Free Gantt Chart Template for PowerPoint — Flow Chart Steps for Project Phases
Let’s be direct: this free Gantt chart template for PowerPoint is technically a flow chart, not a traditional Gantt bar chart. That said, it’s the right format for a lot of project presentations. When your audience needs to understand phases — not specific dates — a connected-step flow communicates faster than a timeline grid. Discovery → Define → Build → Test → Ship. That sequence reads at a glance, even from the back of a conference room.
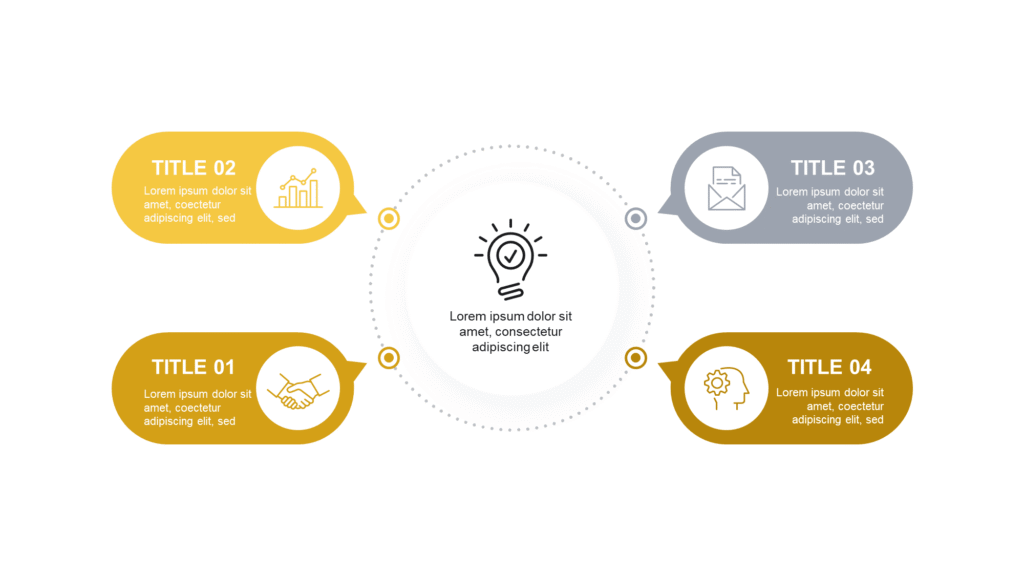
The slide uses a light theme with labeled step blocks connected by arrows. Each block is cleanly sized — no tiny text, no crowding. The layout handles four to six phases comfortably. Push past six and the blocks start to compress; if your project has eight phases, combine the smaller ones. One honest note: if your stakeholders are expecting Gantt bars with task names on the left and horizontal bars across a date axis, this slide won’t satisfy that. Use the $0.99 option below for that format.
📁 PowerPoint + Google Slides + Browser
✏️ Fully editable
$0.99 Gantt Chart Slide — Best for Timeline-Critical Project Reviews
This is the format your stakeholders expect when they ask for a Gantt chart: task names on the left, horizontal bars extending across a timeline to the right. Dark theme — which is the right call here specifically, because the contrast between bars and background keeps the timeline readable even when multiple tasks are overlapping on screen.
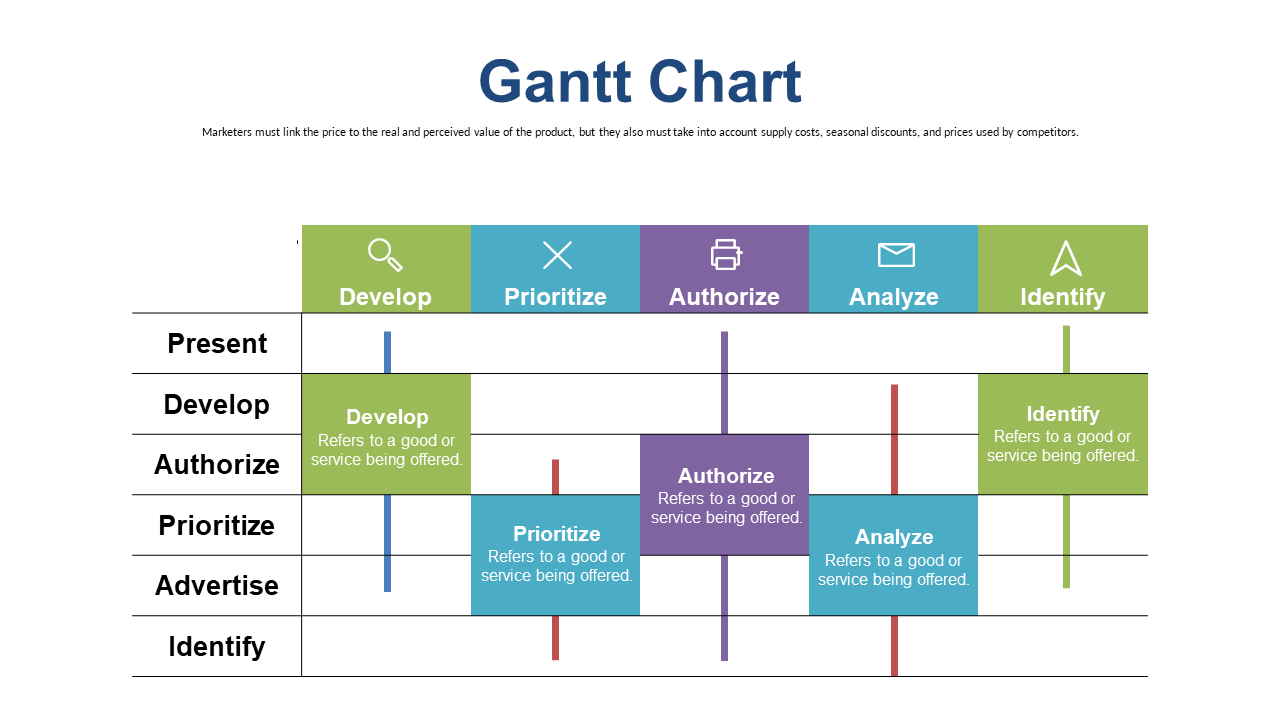
The layout handles realistic project schedules — six to ten task rows, with bars that overlap to show parallel work. That’s where a Gantt chart earns its keep: the moment your stakeholder sees Task B starting while Task A is still running, the plan becomes legible without you having to explain it. If your project has more than ten concurrent tasks, group by workstream. A Gantt with twenty individual rows reads as noise, not planning.
📁 PowerPoint + Google Slides + Browser
✏️ Fully editable
How to Add This Slide to Your Existing Deck
Two minutes, three steps. No design skills needed.
Step 1 — Download and import. You get a .pptx file. In PowerPoint, open your existing deck, go to the slide panel on the left, right-click where you want to insert, and choose “Insert Slides from Another File.” In Google Slides, go to File → Import Slides and upload the .pptx. Both tools preview the slide before you commit, so you’ll see exactly what’s coming in.
Step 2 — Edit task labels and bars. For the Gantt slide, each task row is a text box on the left and a colored rectangle on the right. Click the bar, drag the edges to resize it, and drag the whole shape horizontally to shift it on the timeline. For the flow chart, click any step block and type your phase name. The arrow connectors stay anchored and don’t need repositioning.
Step 3 — Match your deck’s color. Select all bars of the same color, then use Format Shape → Fill to swap to your brand accent in one step. For flow chart blocks, same process. One practical tip: if you’re dropping a dark-theme Gantt slide into a light-theme deck, place it between two content-heavy slides — the contrast actually draws attention to the timeline, which is usually exactly what you want.
Need the Full Deck? — Gantt Chart Vol. 1 in Slate Blue (20 Slides)
If you’re not inserting one chart into an existing deck — you’re presenting the full project — this is the right pick. Twenty slides, Slate Blue color system, available in both Light and Dark themes. Built for project kick-offs, sprint reviews, and delivery presentations where the Gantt chart is one section of a larger story.
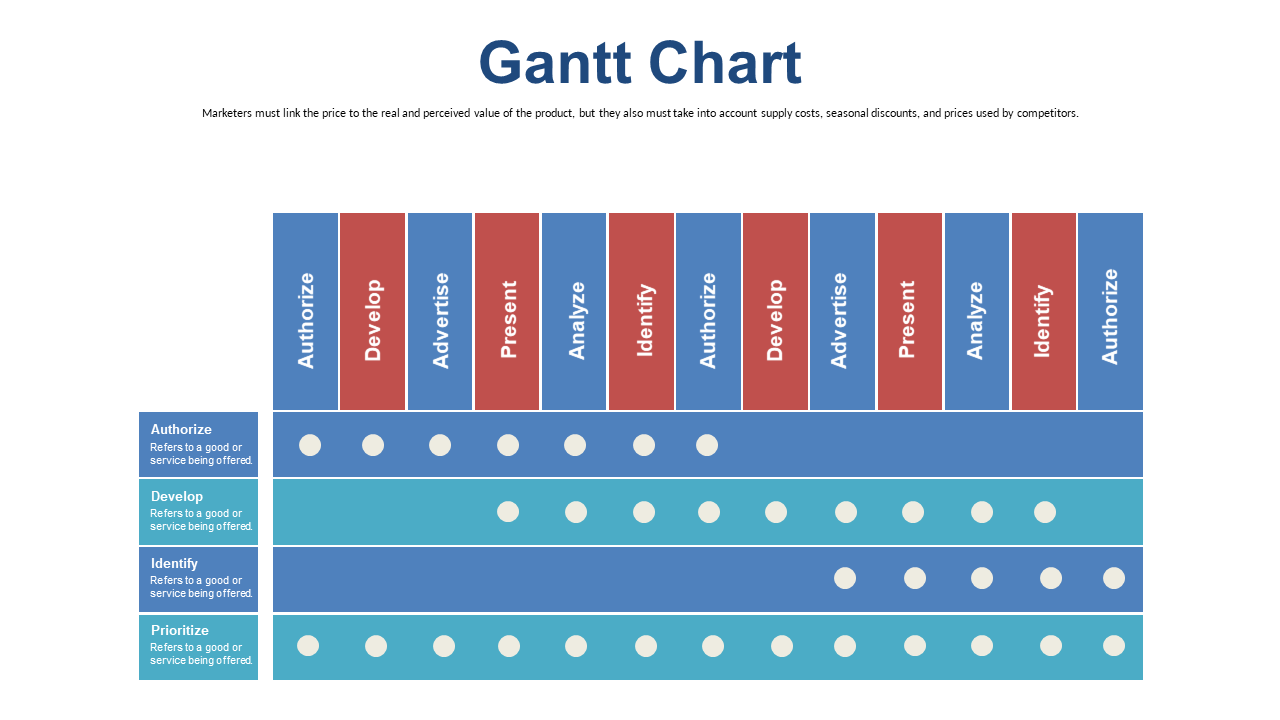
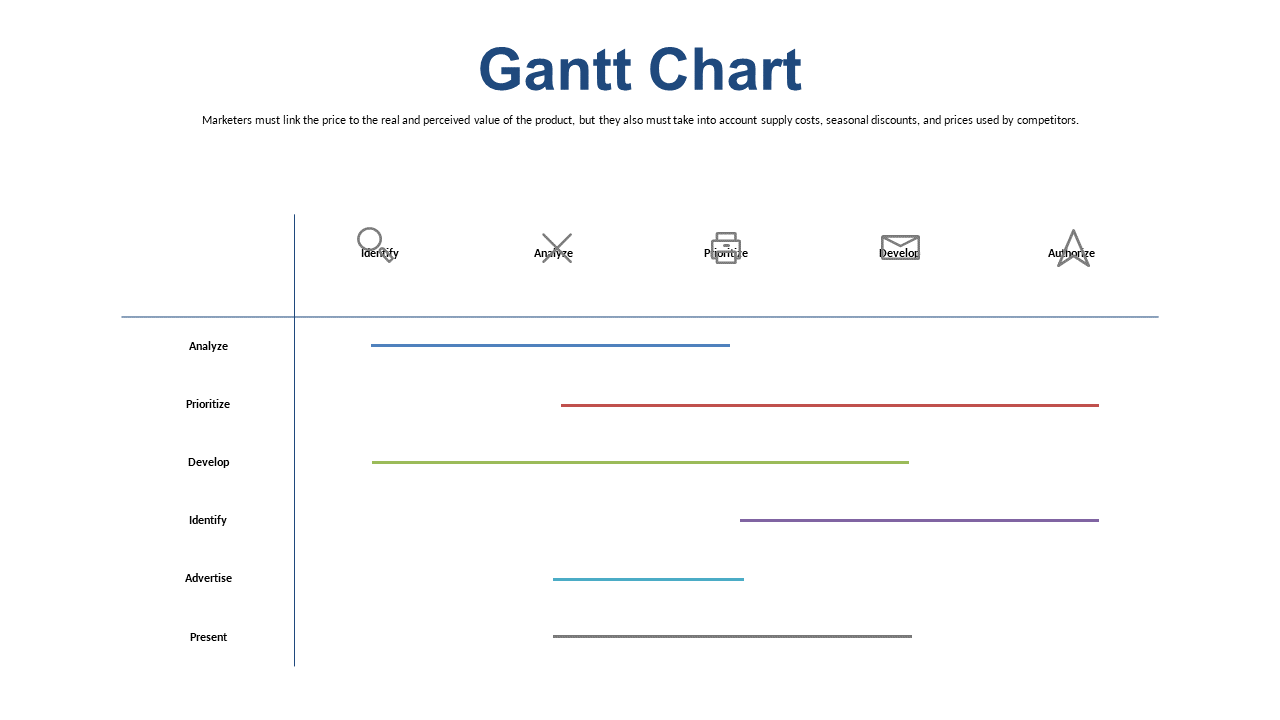
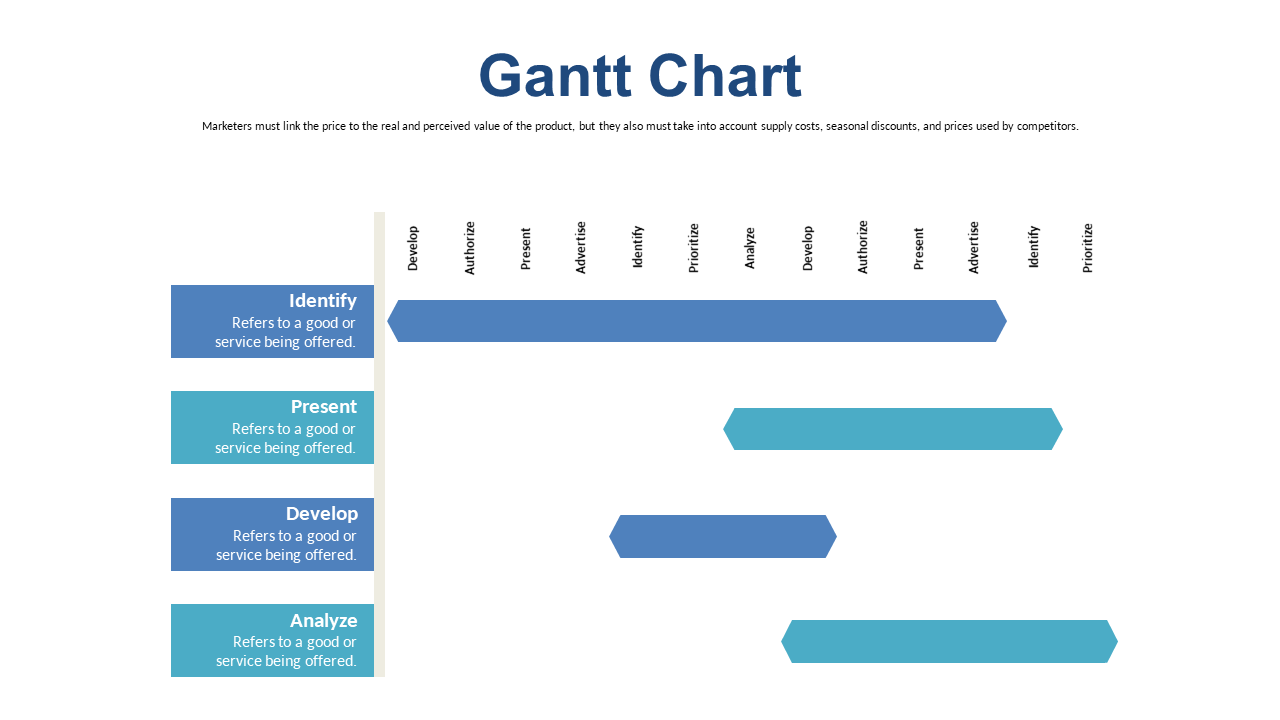
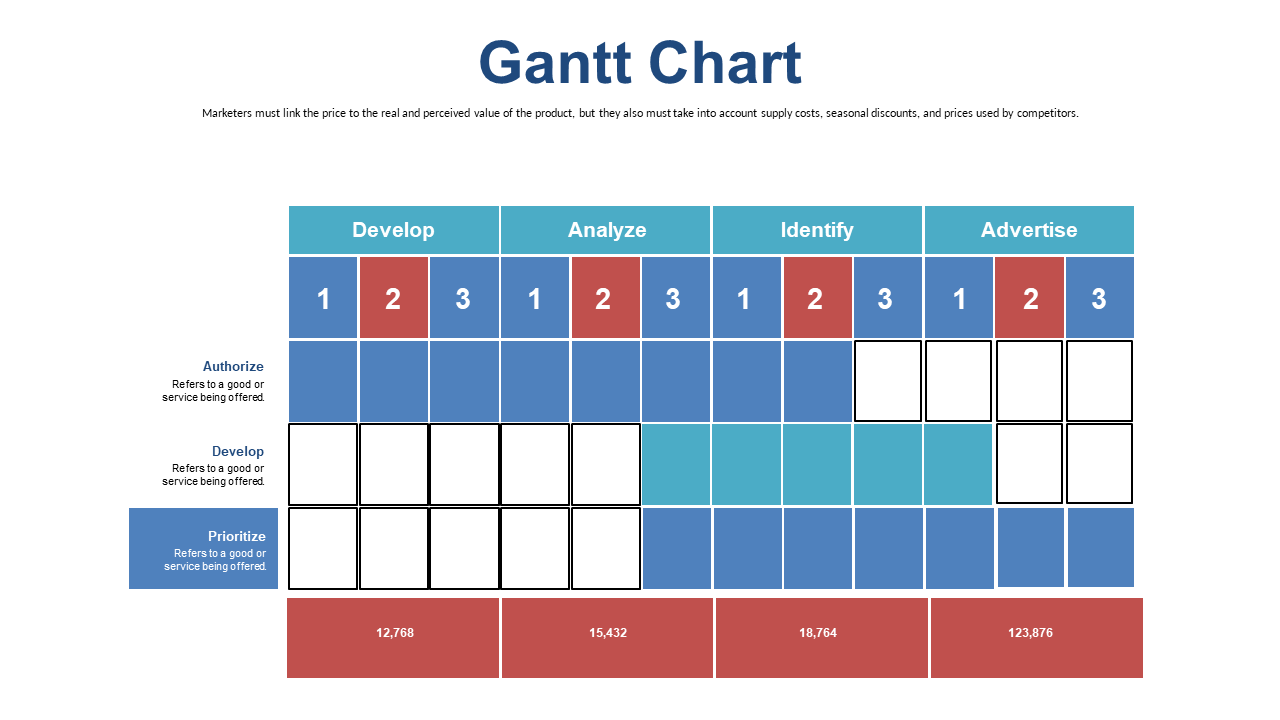
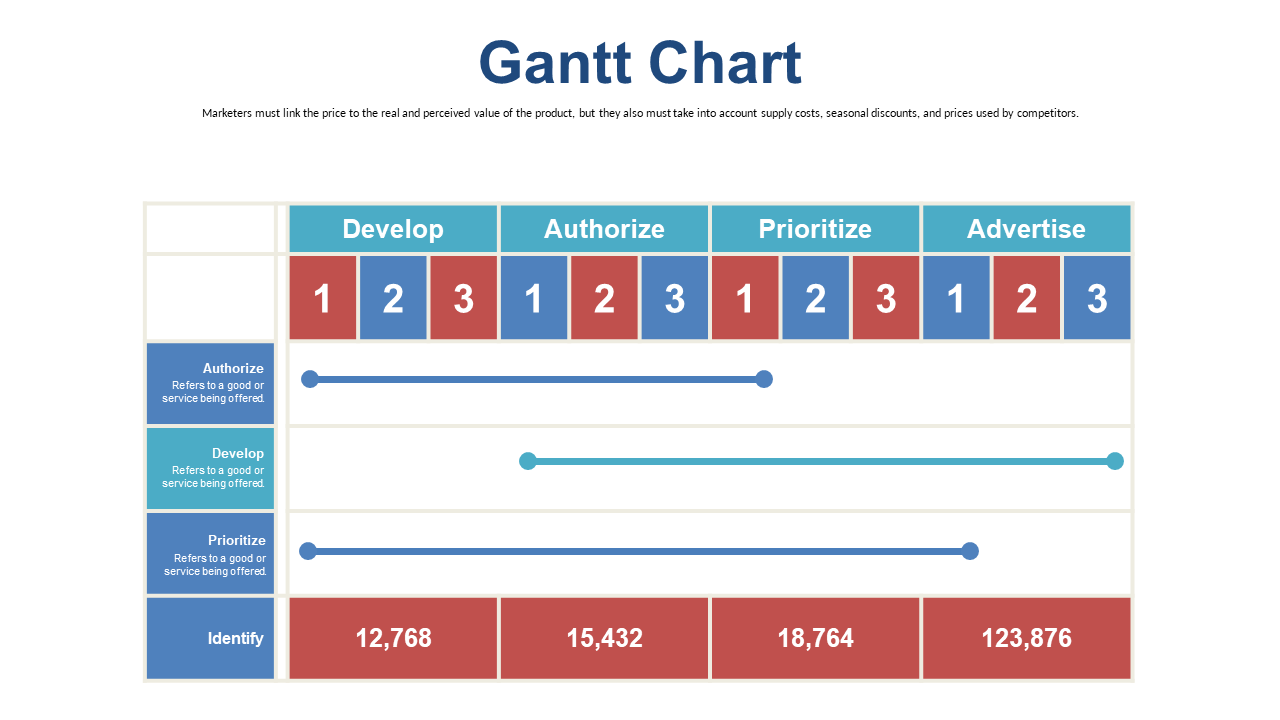
The deck covers what a complete project presentation needs: a timeline overview slide, individual phase Gantt charts, milestone markers, a task dependency view, and summary slides for stakeholder wrap-ups. The Slate Blue palette is neutral enough to sit inside most corporate templates without clashing. One honest note: this is a structured template, not a live project management tool — you edit the bars manually in PowerPoint. If you need bars that update automatically from Jira or Asana, that’s a different category of tool entirely.
🗂️ 20 Slides
📁 PowerPoint + Google Slides + Browser
✏️ Fully editable
Quick Questions
What’s the difference between a Gantt chart and a flow chart in a presentation?
A Gantt chart shows tasks plotted against time — each row is a task, the horizontal bar shows when it starts and when it ends. Use it when your audience needs to see duration, overlap, and parallel work. A flow chart shows sequence — boxes connected by arrows, each representing a phase or decision point. Use it when your audience needs to understand the order of things, not the specific timing. For project presentations: Gantt charts work better for execution updates (“here’s where we are on the timeline”), flow charts work better for process communication (“here’s how the work moves from kick-off to delivery”).
How many tasks can I put on a Gantt chart slide before it becomes unreadable?
Eight to ten rows is the readable limit for most slide formats. Push past twelve and the row height shrinks, labels become unreadable from the back of a room, and bars start to blur together. If your project has twenty tasks, group them by workstream — show four or five groups with sub-tasks collapsed. A Gantt that tries to show everything communicates nothing. Your audience should locate the current phase and the nearest milestone in under five seconds; if they can’t, the chart is too detailed.
Do these templates work in Google Slides, or only PowerPoint?
Both. You download a .pptx file and import it into Google Slides via File → Import Slides. Bars, shapes, and layout carry over cleanly. Text formatting holds. The one thing that sometimes shifts is custom fonts — if the template uses a font your Google account doesn’t have, Slides substitutes a system font. For both of these templates, which use standard sans-serif fonts, that’s rarely an issue. Check the font once after import and swap if needed — takes about thirty seconds.
Want to browse individual Gantt chart slides? The slide library has the full collection filtered by category:
Pick your chart — starts free